
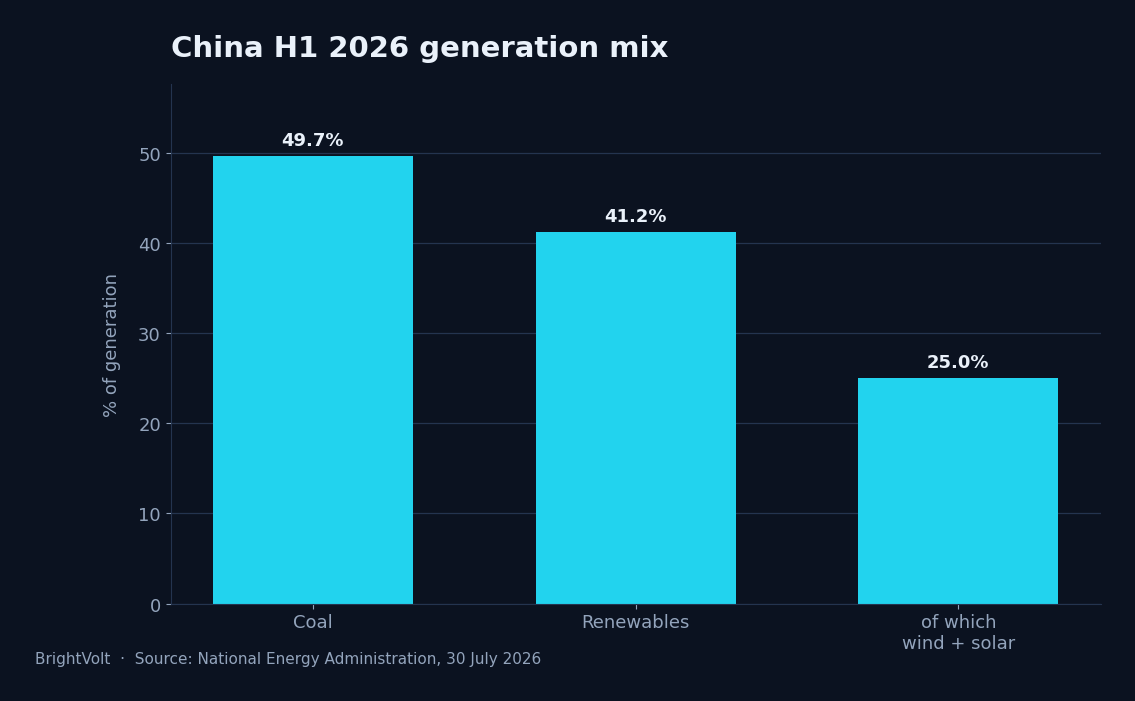
Coal supplied 49.7% of China’s electricity in the first half of 2026 — the first half-year on record below half. China’s National Energy Administration announced the figure on 30 July, alongside renewables at 41.2% and coal generation of 2.5 trillion kWh.
Coal generation still went up.
How a share falls while the thing itself grows
The milestone is a denominator effect. Chinese electricity demand grew faster than coal output, so coal’s slice shrank while the slice itself got bigger in absolute terms.
Bloomberg’s write-up of the same NEA release says so plainly. The Centre for Research on Energy and Clean Air found Chinese coal power up 1.7% year on year in June 2026, the sixth consecutive monthly increase. China’s own National Bureau of Statistics reports thermal power up 0.5% year on year in the same month.
The construction pipeline says the same thing. China started 94.5 GW of new coal plant in 2024, commissioned roughly 78 GW in 2025 — the most in a decade — and added 24 GW in the first quarter of 2026. It retired 3 GW in 2025.
The two official numbers do not agree
Here is the part nobody reported. The NEA’s own arithmetic implies total first-half generation of about 5,030 TWh — 2.5 trillion kWh divided by 49.7%. The National Bureau of Statistics puts first-half generation at 4,750.1 TWh.
Measure the same 2.5 trillion kWh of coal against the NBS denominator and coal is 52.6% — still above half.
The gap is not an error. NBS counts only “industrial enterprises above designated size”, which excludes a lot of distributed solar and small plants; NEA’s series is wider. But it means the below-50% milestone depends on which official Chinese statistical universe you use, and only one of the two produces the headline. That arithmetic is ours rather than either agency’s, and it is worth putting to CREA or Ember before anyone treats 49.7% as settled.
The milestone arrived during a collapse in new solar
Eight days before the coal announcement, the same agency published capacity data showing China installed 72.07 GW of solar in the first half of 2026, down 66% year on year.
| H1 2025 | H1 2026 | Change | |
|---|---|---|---|
| New solar | 212.21 GW | 72.07 GW | −66.04% |
| June alone | 14.36 GW | 12.48 GW | −13.09% |
| Solar fleet | — | 1.27 TW | +15.8% |
| Wind fleet | — | 680 GW | +18.5% |
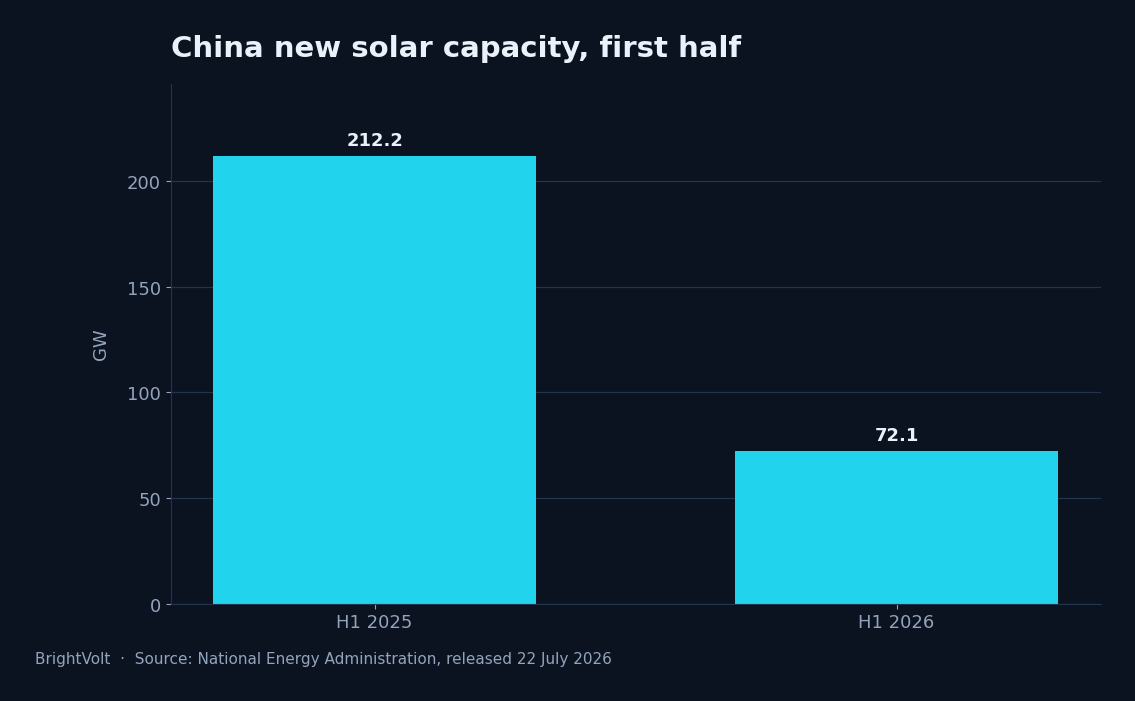
The monthly figures matter more than the headline. By June the year-on-year decline had narrowed from about 70% to 13%. The market did not collapse so much as reset to roughly 12 GW a month after a 2025 that was inflated by a rush to beat pricing reforms.
Curtailment is doing some of the work
Solar utilisation fell to 91.4% from 94.3% a year earlier; wind to 90.9% from 93.5%. Those look like small numbers. They are not.
Carbon Brief’s analysis calculated that Chinese wind and solar could have generated 170 TWh more in the first quarter of 2026 but for rising curtailment — more than France generates in the same period — with wind capacity factors falling from 27% to 22%. Chinese CO2 rose 2% year on year in that quarter.
CREA’s Qi Qin put the problem directly: China has installed enormous amounts of solar and wind capacity, and the question is whether that capacity is being fully used.
China is responding with wires and storage rather than more panels — grid investment up 14% and storage investment up 74%. That is the correct response, and it is slower than installing modules.
What the milestone is actually worth
Something, but less than the framing suggests. A power system where coal supplies under half of electricity is structurally different from one where it supplies two-thirds, and China passed that line a decade earlier than most projections had it. The 41.2% renewables share is real, and about 1.25 trillion kWh of it came from wind and solar, up 9.3%.
What it is not is evidence that Chinese coal is in retreat. Coal generation grew. Coal construction continues at roughly 25 times the retirement rate. The share moved because the rest of the system grew faster, and partly because renewable output was curtailed rather than used.
What to watch
Whether the June solar rate holds. Twelve gigawatts a month annualises to around 145 GW for 2026, which sits between the two live forecasts: the Chinese PV industry association’s 180–240 GW range, issued in February and frequently re-reported as though it were current, and David Fishman’s estimate of roughly 120 GW. The spread between those two is larger than the entire annual American solar market.
And whether utilisation stops falling. If grid and storage investment starts lifting solar utilisation back above 94% while installations run at 12 GW a month, coal’s share will keep dropping for the right reason. If utilisation keeps sliding, the next milestone will be as hollow as this one.
Photo by K on Pexels · Photo by Vladimír Sládek on Pexels