
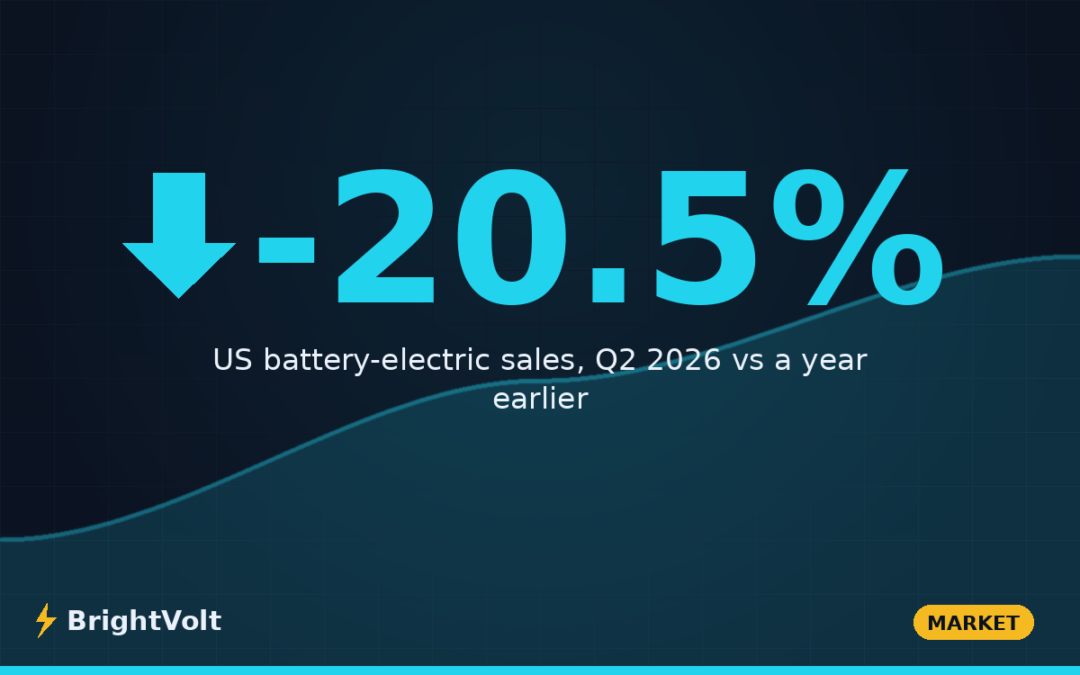
American battery-electric sales fell for the third consecutive quarter between April and June, but the rate of decline has almost halved since the market’s post-subsidy trough. The more consequential number sits one row down the spreadsheet: hybrids sold 592,018 units in the same three months, a 26.2% jump that pushed electrified vehicles to roughly 27% of US retail sales even as the pure-electric slice of that total shrank.
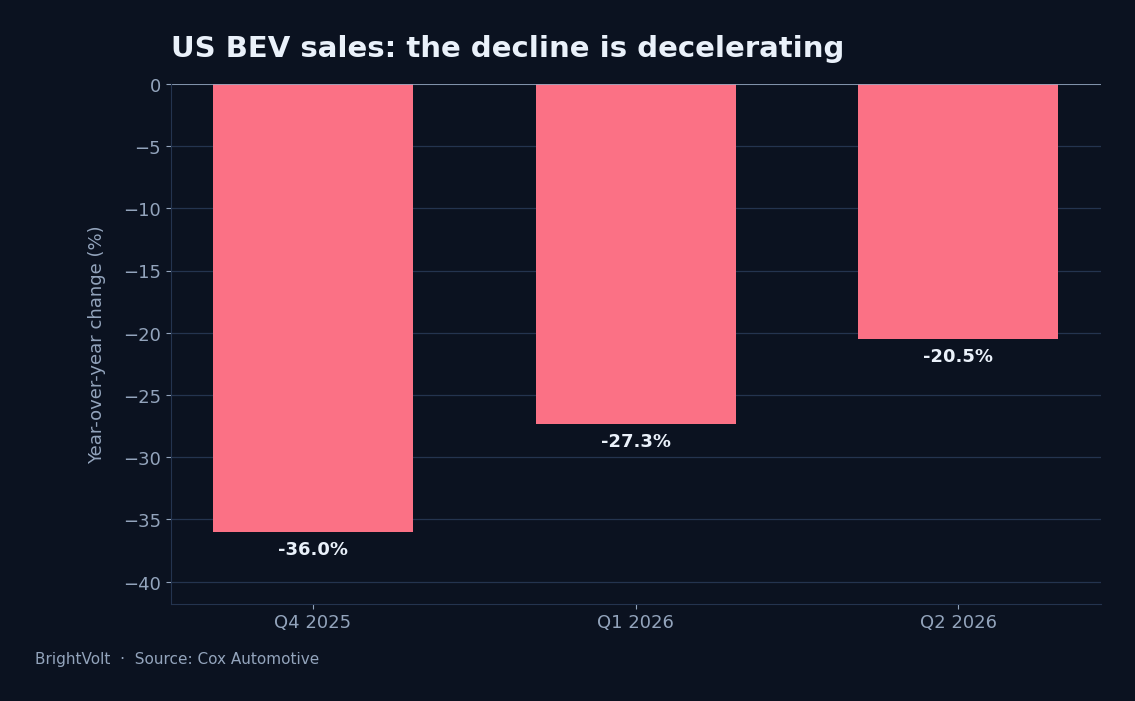
The decline is decelerating, not reversing
Cox Automotive counted 247,226 battery-electric vehicles sold in the US in Q2 2026, down 20.5% year over year but up 14.7% from the first quarter. Set against the preceding two quarters, the trajectory matters more than the headline: BEV sales fell more than 36% year over year in Q4 2025, then 27.3% in Q1 2026, and now 20.5%. Market share has meanwhile flattened at 5.8% of total new-vehicle sales, essentially unchanged from the first quarter.
That pattern is what a market finding a floor looks like. The $7,500 federal clean-vehicle credit expired on 30 September 2025, pulling an unknowable quantity of 2026 demand into the third quarter of 2025 and leaving every subsequent comparison flattering to the prior year and brutal to the current one. Each passing quarter dilutes that distortion. By Q4 2026 the year-over-year comparisons will be measured against an already-depressed base, and the arithmetic alone will make the market look healthier.
Stephanie Valdez Streaty, Cox Automotive’s director of industry insights, framed the next phase as a product problem rather than a policy one, arguing that growth “will likely be driven not only by advances in the technology itself, but by how effectively automakers translate those advances into products that meet consumer expectations for affordability, utility, performance, and ownership experience.”
Why three credible reports disagree about the same quarter
Anyone reading widely about Q2 will encounter three different declines for the same market. They are all defensible, and the gaps between them are instructive rather than embarrassing.
| Source | Q2 2026 volume | Year-over-year | EV share | What is being counted |
|---|---|---|---|---|
| Urban Science | 242,240 | −13.9% | 7.4% | BEV retail registrations |
| Cox Automotive | 247,226 | −20.5% | 5.8% | BEV, total new-vehicle sales |
| IEA | 275,000+ | ≈−25% | ≈7% | Broader electric-car basket |
The volumes are close. The percentages are not, because the denominators differ: retail registrations exclude fleet and rental channels, while total new-vehicle sales include them. An EV market that is holding up better with private buyers than with fleet purchasers will therefore look materially healthier in retail-only data — which is precisely the shape the Q2 figures describe.
The practical lesson for anyone tracking this market is to fix on one source and follow its series over time. Comparing a retail figure from one quarter against a total-market figure from the next manufactures trends that do not exist.
Hybrids are absorbing the demand
The clearest signal in the quarter is not about electric cars at all. Urban Science’s retail data has conventional hybrids at 592,018 units and 18.1% of the retail market, up 26.2% year over year, against battery-electrics at 242,240 units and 7.4%. Plug-in hybrids fared worst of the three, down 26.6% to 46,534 units and just 1.4% share.
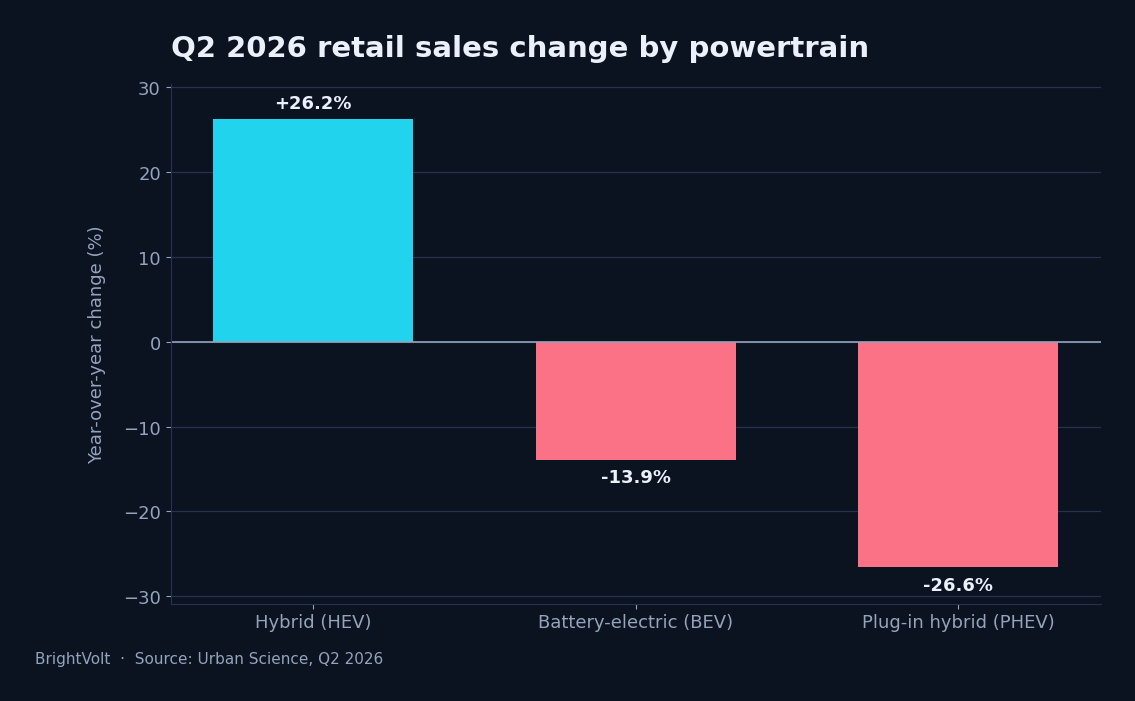
Combined, electrified vehicles reached 26.9% of retail sales in the quarter and 25.2% across the first half while total US retail volume was flat, down 0.2%. Buyers have not walked away from electrification. They have moved down the commitment ladder to the powertrain that requires no charging behaviour, carries no home-installation cost, and lost no federal incentive last September.
The plug-in hybrid collapse is the detail worth sitting with, because PHEVs were widely expected to be the natural refuge for hesitant buyers. Instead the segment fell faster than pure EVs. Plug-in hybrids carry the price premium and complexity of two powertrains, and their appeal leaned heavily on incentives that no longer exist.
Geography still dominates everything. California ran a 48.6% combined electrified share in Q2 — 25.5% hybrid, 19.6% battery-electric, 3.5% plug-in — against 24.4% in Florida, 21.7% in Pennsylvania, 20% in Texas and 19.8% in New York. The gap between California and the next-closest large state is wider than the entire electrified share of most of the country.
The damage is concentrated, not evenly spread
Aggregate numbers conceal a wide spread between manufacturers. GM’s EV sales fell 33.3% to 30,828 units, but the pain within that figure was uneven: the Chevrolet Equinox EV dropped 61.8% to 6,660 units and the Blazer EV fell 68.1%, while Cadillac’s Optiq rose 31.4% to 4,236 and the Sierra EV gained 15.2%. Cadillac contributed 12,216 units against Chevrolet’s 14,848, a remarkably narrow gap between a luxury brand and a volume one.
Ford’s position is harder. Its EV sales fell more than 57% across the first half, and its electric division lost $919 million in the second quarter alone. Tesla, still roughly half the US EV market, was down more than 10% over the same period.
Against that, a handful of manufacturers grew into the downturn. Toyota and Subaru both roughly doubled their EV volumes year over year, with Toyota entering the top five US EV sellers for the first time — behind Tesla, Chevrolet, Hyundai and Cadillac. Mercedes-Benz lifted EV sales 51% on the strength of the electric GLC and CLA. The common thread among the winners is new metal: brands launching fresh product into the downturn gained share, and brands defending two-year-old crossovers lost it.
The international contrast is starker still. While the US and Canada fell around 22% between March and June, Europe grew 33%, Southeast Asia 62%, the rest of Asia-Pacific 101% and Latin America 132%. The American slowdown is a national policy story, not a global demand story — a divergence worth holding in mind against the picture of steady, broad progress that looked reasonable a year ago.
What to watch next
Three things will settle whether Q2 marked the floor. The first is Q4 2026, the first quarter to be measured against an already-post-credit base; if year-over-year growth does not turn positive then, the weakness is structural rather than an artefact of the subsidy cliff. The second is whether hybrid share keeps climbing or plateaus — sustained hybrid growth alongside stabilising BEV volumes would suggest the two are complements rather than substitutes, which is a very different market from the one most forecasts assume. The third is pricing: the winners this quarter were mostly new or newly repriced products, and the segment below $40,000 remains conspicuously thin.
The read that would falsify all of this is simple enough to check. If Q3 2026 shows the year-over-year decline widening again rather than continuing to narrow, then the deceleration in the chart above was the tail of the pull-forward unwinding, not a market finding its feet.