
A solar farm’s capture rate is the share of the average wholesale price it actually earns — and it falls as more solar gets built, because every panel generates in the same midday hours and floods the market it sells into. In spring 2026 Europe’s solar fleet captured a record-low 38% of that average. French solar managed 9.5% in April.
What a capture rate actually measures
Start with the price a generator receives rather than the price on the ticker. A plant’s capture price is the wholesale price weighted by its own output — the price in each hour multiplied by how much it produced then, summed across the period. Its capture rate, or capture factor, is that number divided by the flat average, or baseload, price over the same period, written as a percentage.
A worked example fixes it. Say the average wholesale price across a year is €80/MWh. A round-the-clock nuclear plant sells in every hour, cheap and expensive alike, and earns close to that average — a capture rate near 100%. A gas peaker that only fires up in the scarce evening hours can earn more than the average, a capture rate above 100%. Solar gets no such choice. It sells when the sun is up, and if its output-weighted price comes to €30/MWh, its capture rate is 30/80 — 37.5%. It earns less than half the “average” price, because it never sells into the hours that make the average high.
Why the number falls as you build more solar
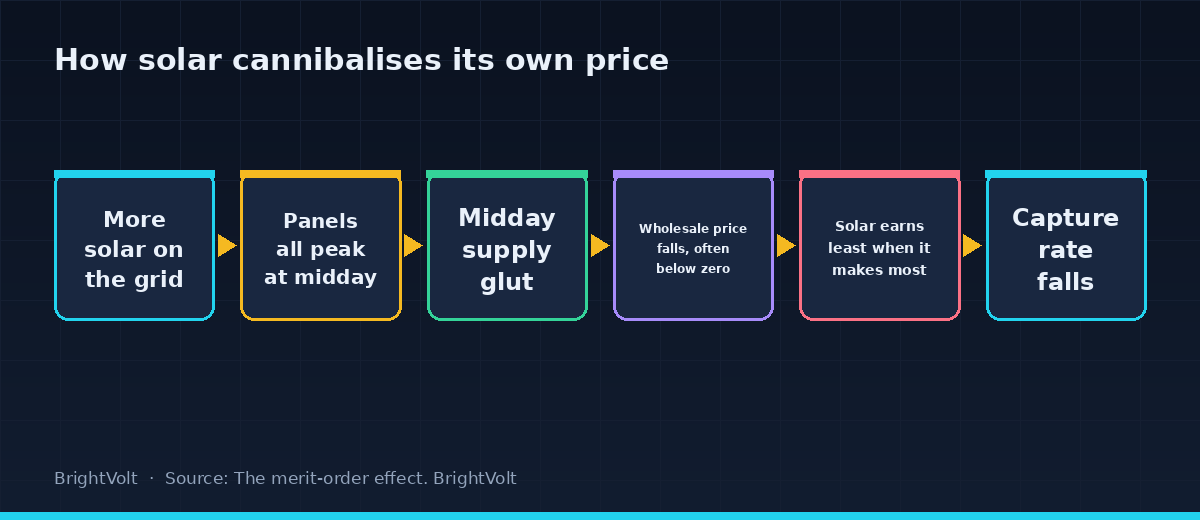
Solar cannibalises its own price, and the effect deepens with scale. The driver is the merit-order effect: solar has near-zero marginal cost, so the grid takes its output first, and when a lot of solar arrives at once it pushes more expensive plants off the system and pulls the clearing price down with them. Build more solar and the midday trough gets deeper. In the worst hours the price turns negative — generators paying to offload power — and solar is running flat out into it.
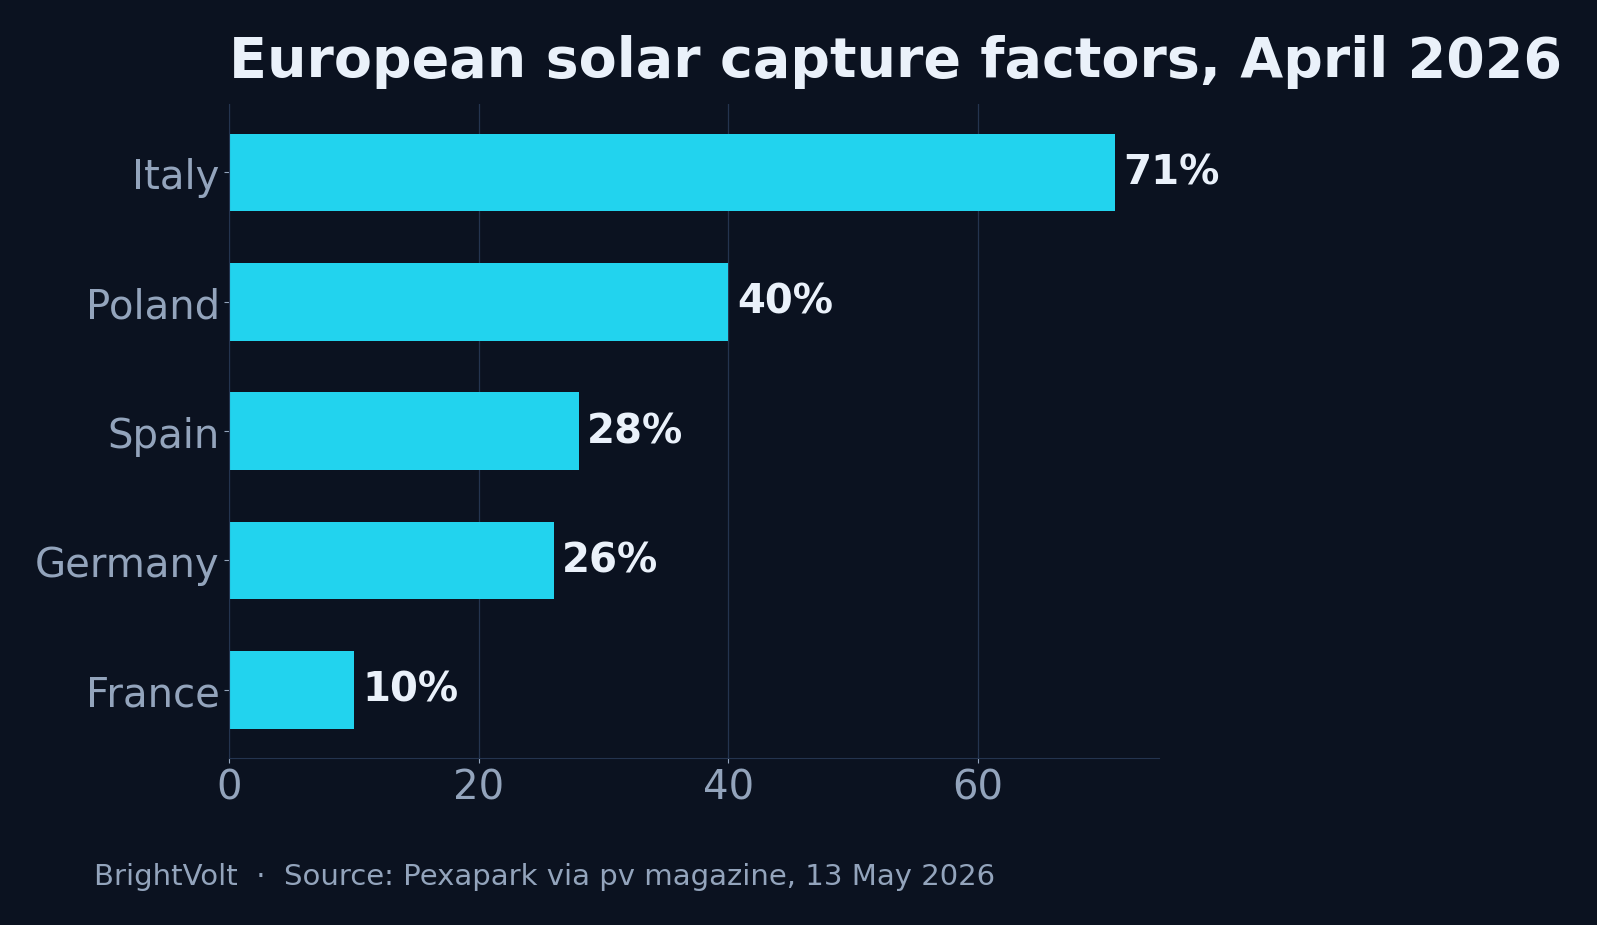
The European figures show the slide in real time. Through 2022 and early 2023 most major markets captured 80 to 100% of the average price, clustered near the top of that band. Since 2024 they have pulled apart and dropped. By April 2026, on Pexapark’s reading, France was down to roughly 10%, Germany 26%, Spain 28%, Poland 40% and Italy 71% — the last its second-lowest April on record.
Negative pricing is the mechanism made visible. France went from 90 hours of negative prices in April 2025 to 139 a year later, and the share of French solar generating into those negative hours climbed from 29% to 45%. Spain, which saw essentially no negative hours in February 2025, logged 148 of them in February 2026. When almost half your output clears at a price below zero, the capture rate is not a statistic. It is the invoice.
It’s seasonal, and that tells you what the problem is
The annual capture rate hides a summer collapse behind a winter that reads as normal. Solar’s worst months are the ones when it generates most; its best are the ones when it barely runs. Kpler’s forward view has French solar capture recovering from the high-40s in late summer to about 101% by December 2026, with Germany on a similar path to 107%. In midwinter a panel produces little, sells into the short and expensive daylight of a cold, evening-peaked system, and briefly earns more than the average.
| Market | Capture rate, April 2026 | Capture rate, Dec 2026 (forecast) |
|---|---|---|
| France | ~10% | ~101% |
| Germany | ~26% | ~107% |
That swing is the whole diagnosis. The capture rate is not a verdict on solar’s cost — panels have never been cheaper — but on timing. Too much identical supply landing in the same hours is a solvable problem, and it is solved by moving the energy, not by building less of it.
What raises a capture rate
The fix is to sell solar into a different hour than the one it was made in, and in practice that means storage. A battery charges at the midday trough, buying the cheap and sometimes negative power that solar created, then discharges into the evening peak once the sun has set and prices climb. The same megawatt-hour of solar now clears a higher-priced hour. Do it at scale and the whole price curve softens: the midday hole fills and the evening spike flattens.
Australia is the live experiment. In the first quarter of 2026, with renewables at a record 46.5% of the grid and rooftop solar setting output records, batteries set the price in about 32% of all trading intervals — lifting depressed daytime prices and softening the evening peak, which is exactly the movement that rebuilds solar’s capture rate from the demand side. Interconnectors do a spatial version of the same trick, exporting a local midday surplus to a region that still has an evening. And flexible demand — EV charging, electrolysers, the “free power” midday windows some utilities now offer — drags consumption toward the glut instead of away from it.
None of this makes the merit-order effect disappear. It moves the output out of the hour the effect punishes, which is the only lever that actually works.
Why the metric decides the buildout
The capture rate is the number a solar project is financed against. A power-purchase agreement is priced off the developer’s expected capture price, so a market where the rate is sliding is one where the next project is harder to bankroll no matter how cheap the panels get. That is why “record solar output” and “record-low capture rate” are not contradictory headlines — they are the same headline, and it is the number behind BrightVolt’s argument that Europe’s solar problem is one of value, not volume.
Watch whether storage deployment keeps pace with solar deployment. Where it does, as in Australia, Texas and California, capture rates should steady even as penetration climbs. Where it lags, as in France and Spain this spring, they keep falling until the storage arrives or the building stops. The gigawatt count tells you how much solar exists. The capture rate tells you whether the next gigawatt is worth building.
Photo by K on Pexels · Photo by Ramesh Kambattan on Pexels