
States that voted for Trump in 2024 installed 71% of the new solar capacity the United States added in the first half of 2026, according to SEIA and Wood Mackenzie’s latest Solar Market Insight report. Texas alone built 3.44 gigawatts, more than the next two states put together. The government those states elected is trying to end the credits that helped start it.
Where the new solar is actually going
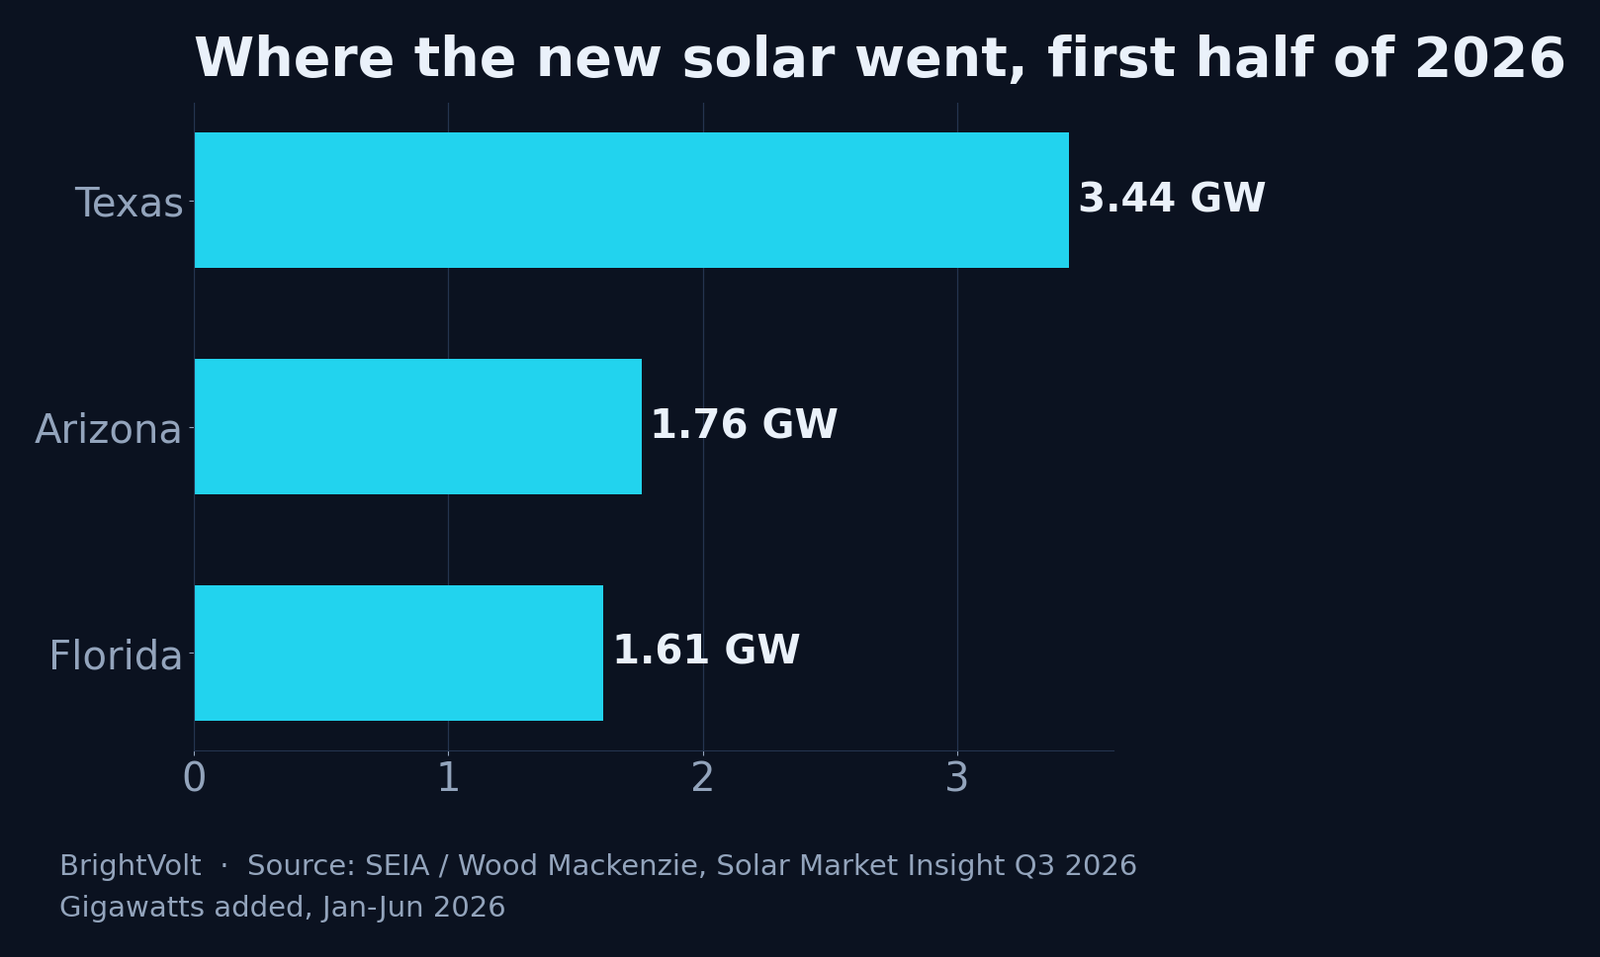
The concentration is the story before the politics is. In the first half of 2026, Texas (3.44 GW), Arizona (1.76 GW) and Florida (1.61 GW) took the top three places for new solar, and eight of the ten states building the most voted Republican in the last presidential election. Texas has now led the country in 2024, 2025 and again through mid-2026. Michigan climbed from 23rd to 4th in the same stretch — not a swing state’s gesture at green policy, but a manufacturing state chasing cheap megawatts.
Read against Washington’s direction of travel, the map looks upside down. The One Big Beautiful Bill, signed in July 2025, set a clock running on the solar tax credit; the Interior Department has added a federal-approval step for projects on public land. The direction from Washington is less support, not more. And the places installing the most solar are, overwhelmingly, the places that returned that administration to office. The paradox only holds if you assume the credit was the reason anyone built. It wasn’t the reason Texas built.
Why the reddest grids build the most
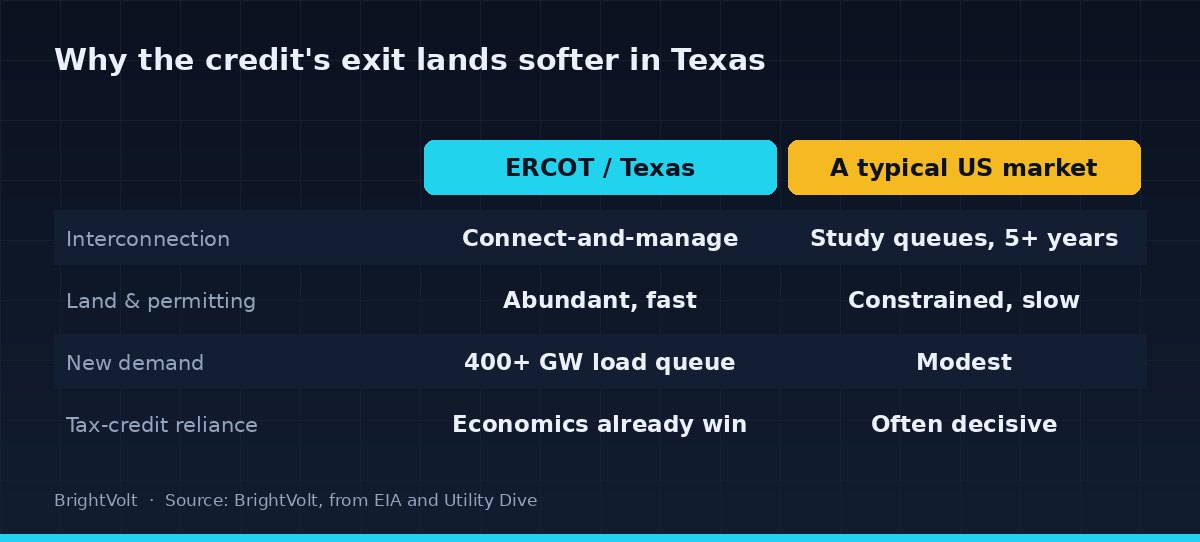
Because the economics were settled before the subsidy showed up. Solar wins fastest where three things line up — strong sun, cheap flat land, and a grid that will connect a project without a five-year wait — and Texas has all three by a wide margin. ERCOT, the Texas grid, runs a “connect-and-manage” interconnection model that lets a plant plug in and sort out congestion afterwards, rather than the multi-year study queues that stall projects in most of the country. Land is abundant and permitting is quick. The panels are the same everywhere; the time-to-build is not.
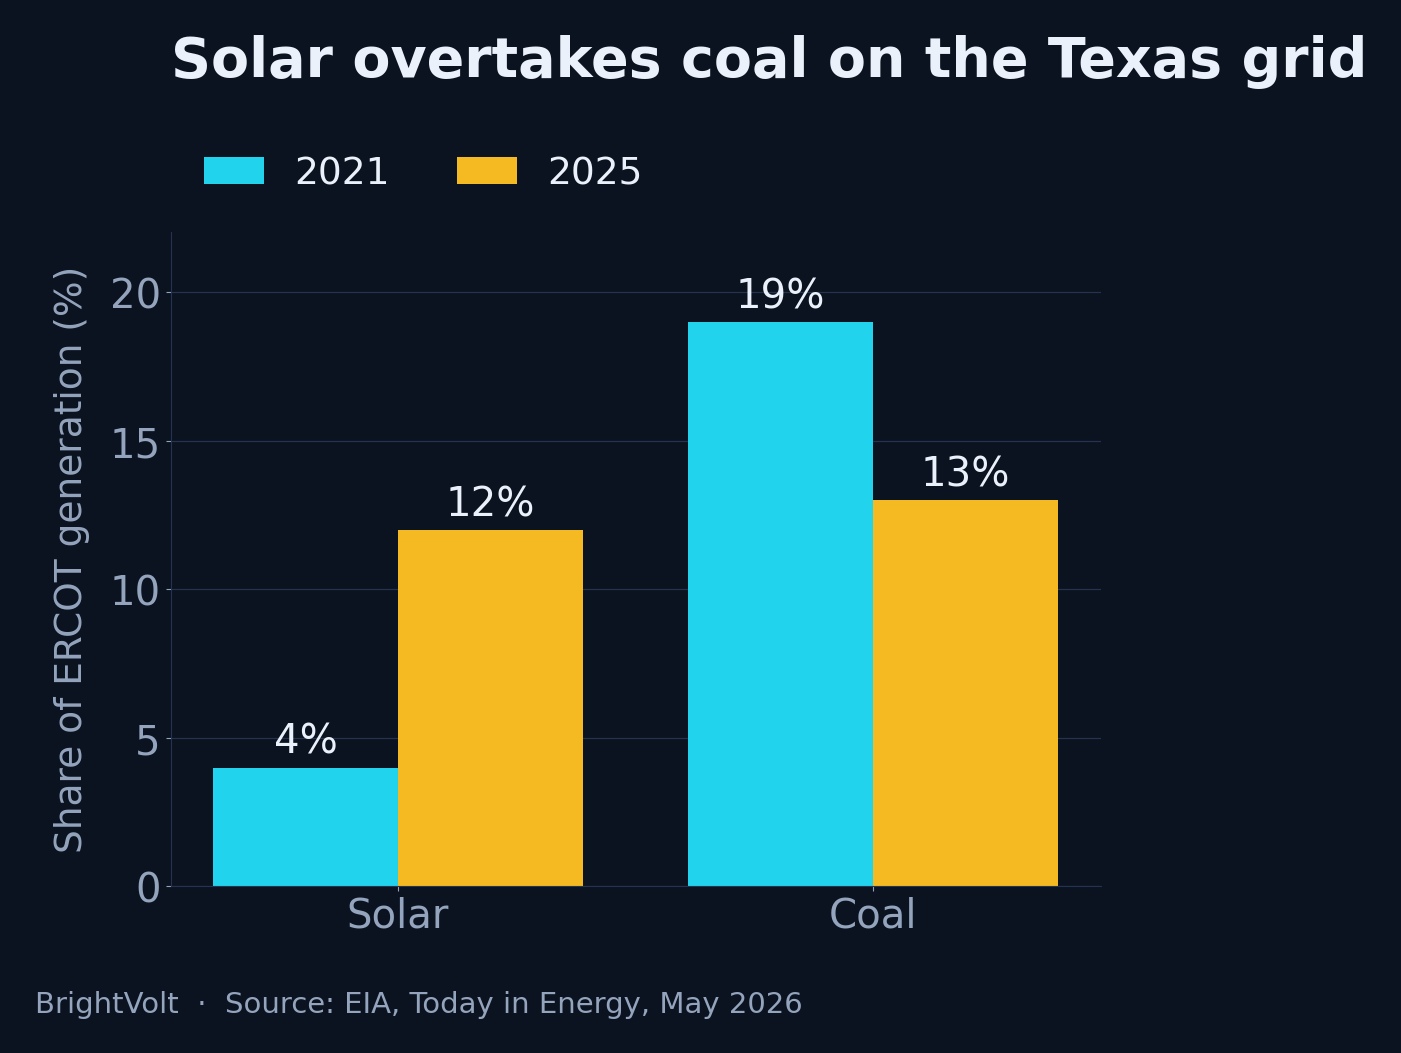
The result is a grid that has quietly reordered itself. The EIA expects utility-scale solar to out-generate coal across ERCOT for the first time in 2026 — about 78 billion kilowatt-hours of solar against 60 for coal — after solar’s share of the Texas mix rose from 4% to 12% between 2021 and 2025 while coal’s fell from 19% to 13%. Roughly two of every five gigawatts of US solar added this year are going into Texas alone.
Demand is doing the rest of the arguing. Data centers, crypto miners and new industry have pushed ERCOT’s large-load interconnection queue past 400 gigawatts of requests, and the grid operator now forecasts peak demand roughly doubling within six years. A utility facing that curve needs capacity it can switch on in eighteen months, not the eight years a gas turbine or a reactor takes to reach the wire. Solar is the only thing on the menu that builds that fast. SEIA’s chief executive, Tim Pawlenty — a former Republican governor — puts it in plainer terms than the trade body usually manages: red states have “a pro-build mentality,” the land, the permitting, and the electricity-hungry industries that want the cheapest power they can get quickly. None of that is on a federal form.
The record quarter that’s already borrowed
The national number that ran alongside the state one was a genuine record: 11.4 GW installed in the second quarter, up 45% on a year earlier. But the record hides a split down the middle of the industry.
| Segment | Q2 2026 installed | Change year-on-year |
|---|---|---|
| Utility-scale | 9,600 MW | +61% |
| Commercial | 638 MW | +11% |
| Residential | 995 MW | −12% |
| Community solar | 231 MW | −14% |
Utility-scale did almost all the work, and a good part of that 61% is not growth so much as a sprint. Developers are racing to start construction before the 4 July 2026 deadline that decides whether a project keeps the investment credit, pulling next year’s builds into this one. The rooftop line tells the opposite half of the story: the residential credit that covered 30% of a home installation expired at the end of 2025, and home solar has been shrinking every quarter since. The same policy did both — it yanked utility-scale forward and knocked distributed solar down — which is why one number went up 61% and another went down 12% in the same three months.
What survives the cliff
Strip the credit away and the question is not whether US solar keeps growing but where it keeps growing. The pull-forward guarantees another record or two into 2027, because those plants are already under construction — a point worth keeping separate from the road ahead. What matters is the floor the market settles to once the rush clears, and Wood Mackenzie’s own forecast is telling: roughly 44 GW a year through 2031, broadly flat, even as electricity demand climbs. Flat, in a market whose demand is rising, means the policy is costing real capacity.
But it will not cost it evenly, and that is what the red-state map is really showing. Where solar is the cheapest, fastest way to answer a demand curve that is going vertical — ERCOT, the desert Southwest, the industrial Midwest — the loss of a tax credit trims the margin and the build continues. Where a project only ever penciled out because of the credit, and where it also has to survive a multi-year interconnection queue and a transformer shortage, the credit’s exit is the difference between built and shelved.
The honest indicator, the one no press release leads with, is construction starts after the July deadline. If new utility-scale capacity entering construction through late 2026 and 2027 holds near its 2025 pace, the economics are carrying the industry without the subsidy and the cliff is a speed bump. If starts fall off while the generation figures keep setting records, the two numbers will get quoted against each other for a year by people who haven’t noticed they describe different points in time. Watch the states that voted to end the credit. They are the ones with the least reason to stop building anyway — and the clearest test of whether solar in America still needs Washington’s help, or has simply outgrown it.
Photo by Giant Asparagus on Pexels · Photo by Hoan Ngọc on Pexels