
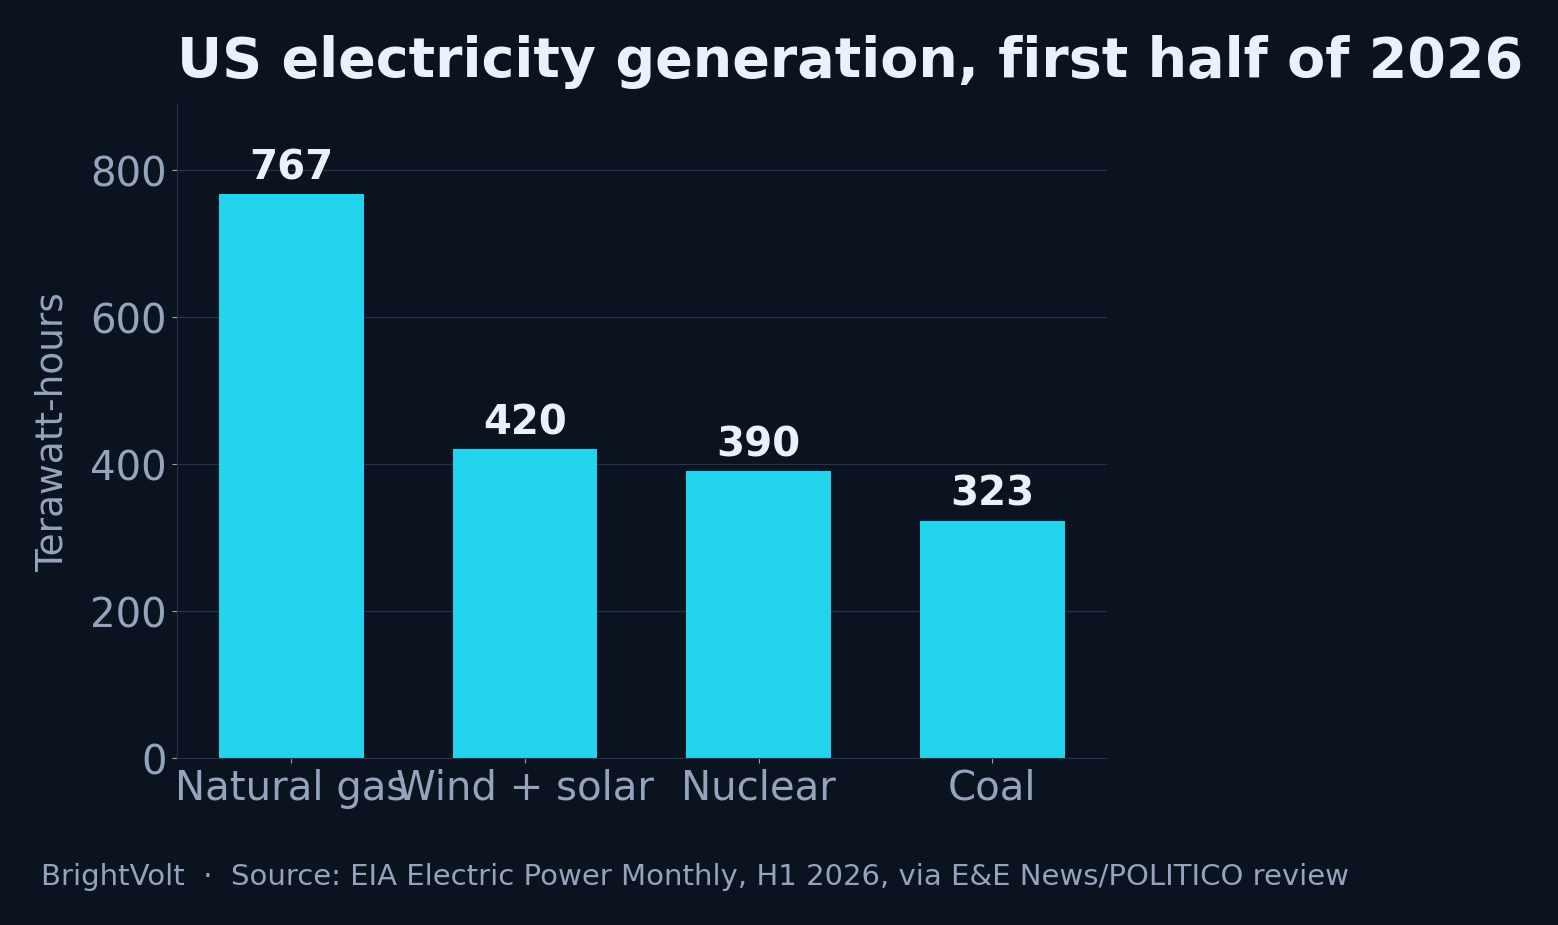
In the first half of 2026, US wind and solar generated about 420 terawatt-hours — 20% of the country’s electricity, up from 18.6% a year earlier — and passed both coal and nuclear for the first time in a comparable six months, according to federal generation data reviewed by E&E News. It happened in the same six months Washington cancelled the subsidy that built it. Both facts are true, and the second one does not undo the first — because they are measuring different years.
The record is a rear-view mirror
A gigawatt of solar that generated in June 2026 was financed in 2023, permitted in 2024, and bolted down in 2025. The electricity meter reads the past. What Congress changed in July reaches into the future, and the two barely overlap.
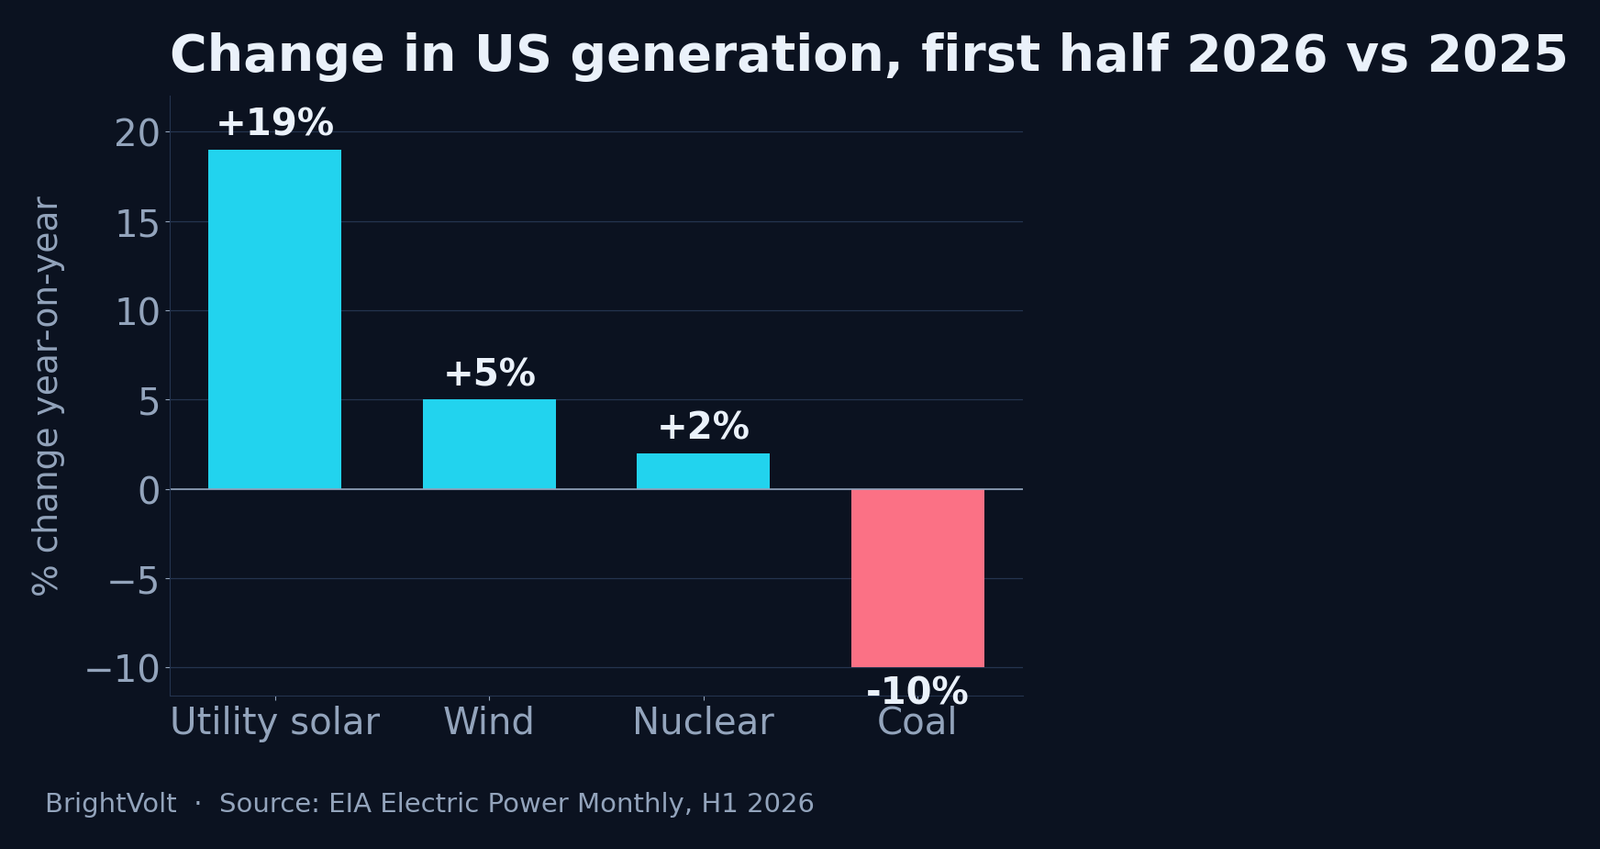
That is the trap in the first-half numbers. Coal fell about 10% year-on-year to 323 TWh; nuclear rose 2% to 390 TWh; natural gas held roughly flat near 767 TWh; wind and solar together climbed 10% to 420 TWh. Read as a scoreboard, it looks like the transition shrugging off politics. It is nothing of the sort. It is a pipeline emptying — projects that cleared interconnection and broke ground before the rules moved, arriving on schedule. The output is real. The inference that the policy fight didn’t matter is not.
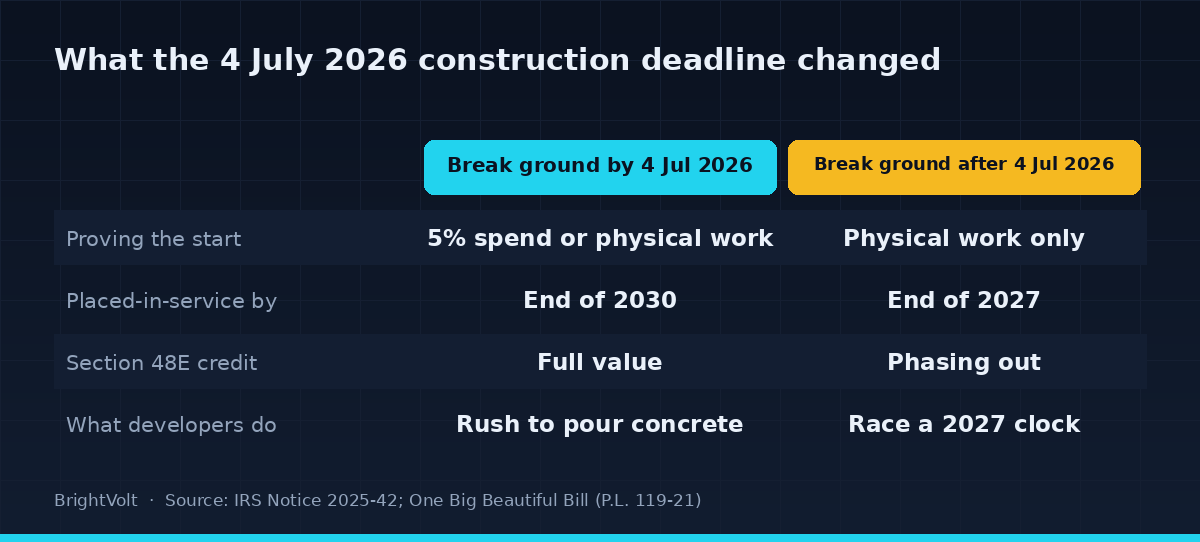
The One Big Beautiful Bill, signed on 4 July 2025, did not switch anything off in 2026. It set a clock. Wind and solar projects that begin construction after 4 July 2026 must now be placed in service by the end of 2027 to earn the Section 48E investment credit at all; projects that broke ground before that date keep the credit and have until the end of 2030 to switch on. A subsidy that decides whether a project pencils out does not stop the plants already running. It stops the next ones from starting.
Why solar jumped 19% and wind only 5%
Split the 10% and the story changes. Utility-scale solar rose about 19% in the half; wind rose 5%. That gap is not two technologies at different points on a growth curve. It is one of them running for a door that is closing.
Solar is modular, fast to build, and — critically — easy to start. And the definition of starting is exactly what the IRS tightened. Notice 2025-42, issued a month after the bill, scrapped the old 5% safe harbor — the rule that let a developer bank a project’s eligibility simply by spending 5% of its cost — and left only the physical work test: real excavation, real foundations, real racking. Paper commitments no longer count. So developers are pouring concrete now, before 4 July 2026, to lock a project into the generous 2030 window rather than the punishing 2027 one. Some of the solar in the first-half figures is not the industry thriving. It is the industry sprinting to beat a deadline, and pulling 2027’s projects into 2026 to do it.
A pull-forward looks identical to growth while it is happening. It reads the opposite afterwards. Pull a year of demand into the present and the present looks wonderful; the following year inherits the hole. This is the mechanism that made rooftop solar’s own 2025 rush look like a boom right up to the cliff edge. The same shape is now printing at utility scale.
The deadline splits the industry into two futures depending on one date — and the difference is not subtle.
The strongest case for staying calm
Here is the argument for not panicking, in its best form. Solar is now the cheapest new generation most American utilities can build, credit or no credit. “Utilities building new generation are choosing solar because it is fast and cheap,” former FERC commissioner Nora Brownell told reviewers of the data. If the economics stand on their own, the credit was a tailwind, not a foundation, and its removal slows the build without stopping it. On that reading the pipeline refills at a lower level and the line keeps climbing.
The case is right about the destination and wrong about the road. “Cheapest” is a statement about levelized cost; a project is financed on its return, and stripping 30% of after-tax value out of that return is not a rounding error, however cheap the panels. The safe-harbor stampede is the proof: if the credit were incidental, nobody would be sprinting to bank it. And even a project that pencils out still has to be built, into interconnection queues measured in years and against a transformer shortage that is already the binding constraint on new grid connections. The credit was the thing offsetting those frictions. Remove it and the marginal project — the one that was going to tip the queue next year — is the one that now doesn’t.
What to watch, and what would prove us wrong
Stop watching the generation mix. It will keep setting records into 2027 and possibly beyond, because the plants delivering those records are already under construction, and a record built from a rear-view mirror tells you nothing about the road ahead. The honest indicator is the one nobody puts in a headline: construction starts after 4 July 2026. If new utility-scale solar and wind capacity entering construction in the back half of 2026 and through 2027 holds near its 2025 pace, then Brownell is right, the economics carry the industry without the subsidy, and this Take is wrong. Track it in EIA’s monthly capacity data and the quarterly SEIA/Wood Mackenzie figures, the first clean one of which — untouched by the deadline rush — is the number that settles it.
Our read: the second half of 2026 posts a record for generation and a slump for starts, and the two get quoted against each other for a year by people who haven’t noticed they describe different points in time. The output is the pipeline emptying. The starts are the pipeline refilling, or not. Only one of them is news about the future, and it is not the one that just beat coal.
Photo by Giant Asparagus on Pexels · Photo by Hoan Ngọc on Pexels