

Voters backed limits on data centers in 40 of the 41 local ballot measures held on 3 November, and 21 of those 41 votes were in Ohio. Three days later, a fresh round of research landed with the opposite message: nationally, data centers have barely moved household power bills. Both are right. Read past the headlines and the studies’ own fine print says the effect is concentrated in places that look a great deal like Ohio.
That is the part the “data centers aren’t raising your bill” headlines skip. The research does not say the effect is small everywhere. It says the effect is small on average, and it names the conditions that make it large: investor-owned utilities, restructured power markets, and wholesale regions where new load arrives faster than new supply. Ohio ticks every box.
What did voters actually decide on 3 November?
Forty-one measures in ten states went on the ballot, and the data-center side lost all but one, according to Al Jazeera, citing the Data Centers on the Ballot tracker; Baxtel reached the same 40-of-41 count from Ballotpedia’s tracker. The lone exception was Harwood, North Dakota, a town of under 800, where voters rejected a charter amendment that would have added public review for large industrial projects.
Everywhere else, the margins were not close. Granville, Ohio, banned data centers by 82% to 18% and Defiance capped projects above 25 MW by 65% to 35%, on Baxtel’s unofficial county figures. Emporia, Kansas, banned “high impact” sites with a peak load over 10 MW, and Alhambra, California, is on course for an outright ban, per Route Fifty.

Bills were not the only grievance. Water, noise and land use all appear in the campaign coverage, and Baxtel’s write-up does not mention power prices at all. But the bill is the argument the industry most wants to win, because it is the one that travels beyond the township line. And it is the argument the week’s research was being used to settle.
Do data centers raise electricity bills? What the new studies say
On the average, barely. On 6 November the Washington Post reported a new Harvard and University of Pennsylvania study that attributes just 4% of utility rate increases over the past five years to data centers, and 15% of the industrial price increase between 2020 and 2025. “So far we have no evidence that data centers increase prices all that much,” co-author Serguei Netessine of Wharton told the paper; he blames gas prices, an ageing grid and storm repairs instead.
It is not alone, and the corroboration is worth reading closely, because the agreement is narrower than it looks.
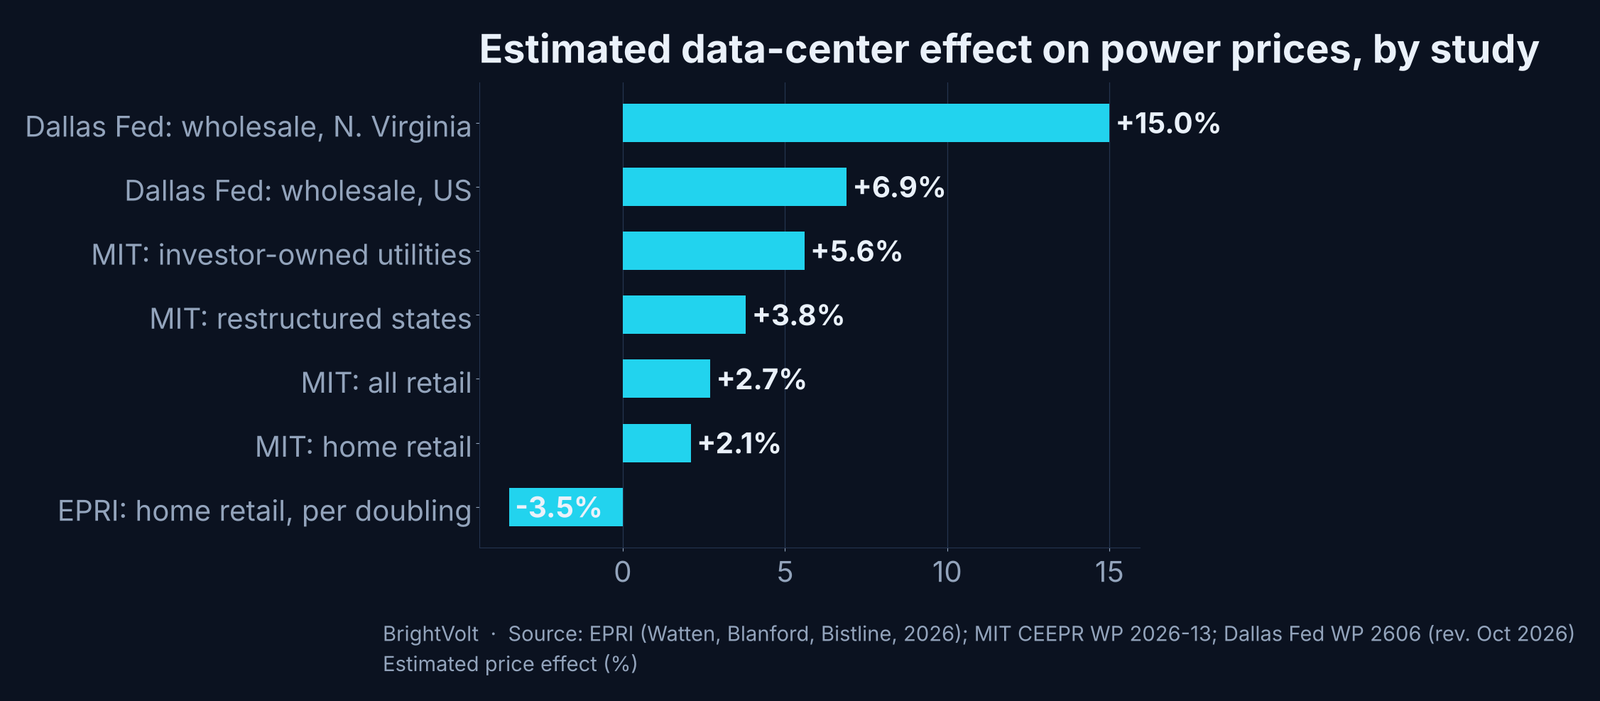
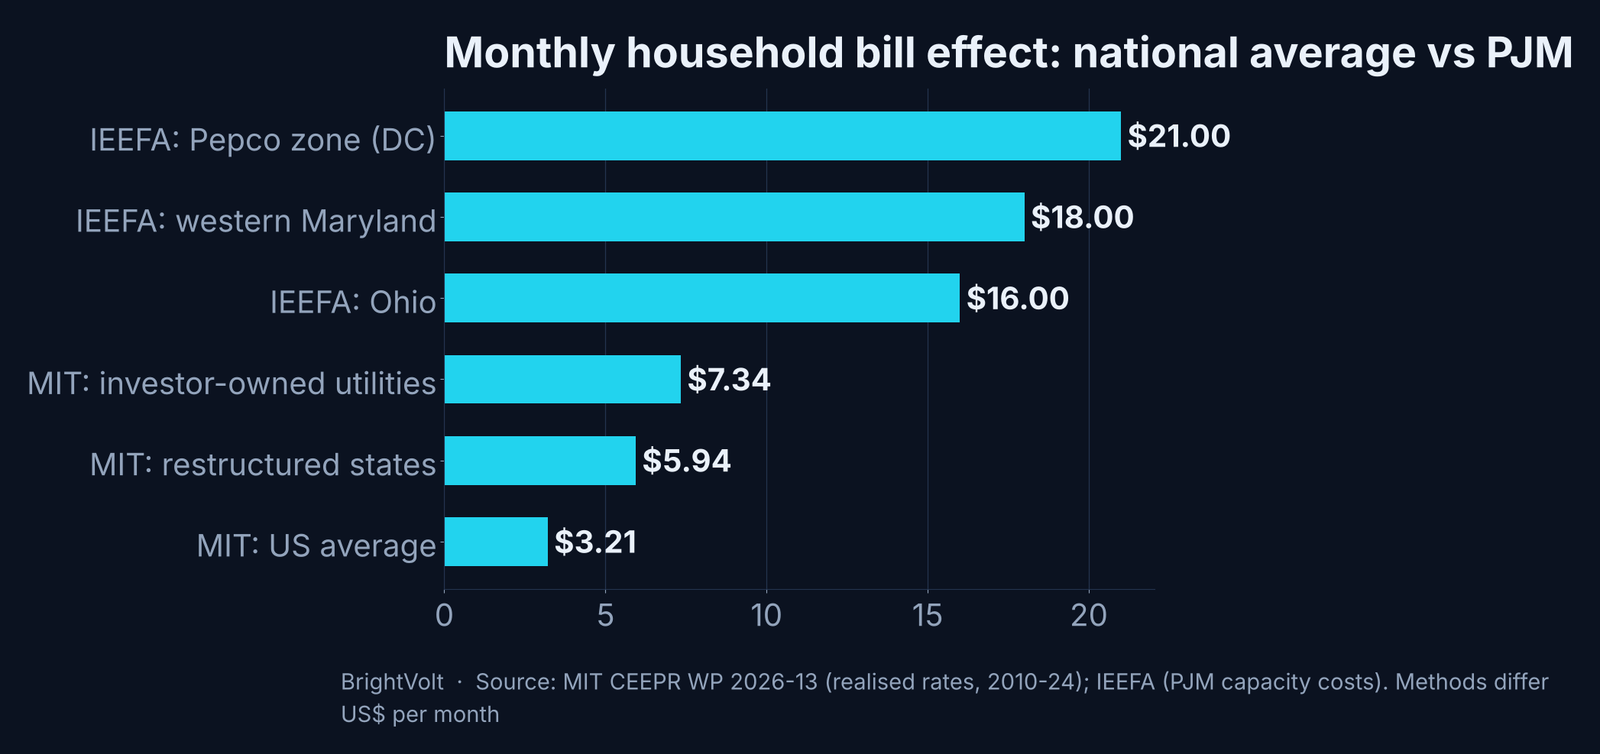
An EPRI paper from June goes further, finding that a doubling of a state’s data-center capacity lowered residential prices by 3.5% over 2015–2024, the signature of more load spreading fixed grid costs across more kilowatt-hours. (The Post rounded this to 4%.) A June working paper from MIT’s Center for Energy and Environmental Policy Research, revised in October, finds the opposite sign but a modest size: data-center entry raised residential rates by 2.1% between 2010 and 2024, about $3.21 a month for the average household.
Then come the qualifications, and they do the real work. In the MIT paper the effect is “concentrated among investor-owned utilities”, at 5.6% across all classes and 5.2% for homes — $7.34 a month. In restructured states it is 3.8%. Among co-operatives there is no systematic response at all. The EPRI authors, for their part, warn that turbine backlogs and transformer shortages “could reverse the effect.”
Why the national average hides the problem
A national average is a blend of places where the effect is zero and places where it is not. The MIT and EPRI estimates fold co-operatives, municipal utilities and investor-owned utilities, cheap-power states and strained ones, into a single coefficient. The co-ops pull the number down. The question for any particular household is which kind of utility it buys from.
The wholesale market tells the same story more bluntly. A Dallas Fed working paper, revised in October, runs an hour-by-hour, plant-by-plant dispatch model of 23 US power regions with and without data-center load. It finds data centers raised wholesale prices by 6.9% nationally by 2025, and by 15.0% in northern Virginia; in Florida and parts of the interior South, the effect was as small as 1%. Its preferred forecast puts the national figure at 12.3% by 2028. The authors add that retail effects are probably understated, because the model counts no extra fixed grid costs.
| Study | What it measures | Period | Headline effect | Where it is largest |
|---|---|---|---|---|
| Harvard / Penn (SSRN) | Share of rate increases due to data centers | 2020–2025 | 4% of increases; 15% for industrial | Industrial customers |
| EPRI | Residential retail price, per doubling of capacity | 2015–2024 | −3.5% | Authors warn supply limits could flip it |
| MIT CEEPR | Retail price after a large data center arrives | 2010–2024 | +2.1% residential; +2.7% all | Investor-owned utilities (+5.6%), restructured states (+3.8%) |
| Dallas Fed | Wholesale price, modelled | 2021–2025, forecast to 2028 | +6.9% national (2025) | Northern Virginia (+15.0%), Pacific Northwest (+15.4%) |
None of these numbers contradicts the others. They measure different things, over different years, at different points between the power plant and the meter. Lined up, they describe a gradient: the closer you get to a wholesale market straining under new load, served by a utility that recovers its grid spending through rates, the bigger the effect becomes.
Why Ohio sits at the wrong end of that gradient
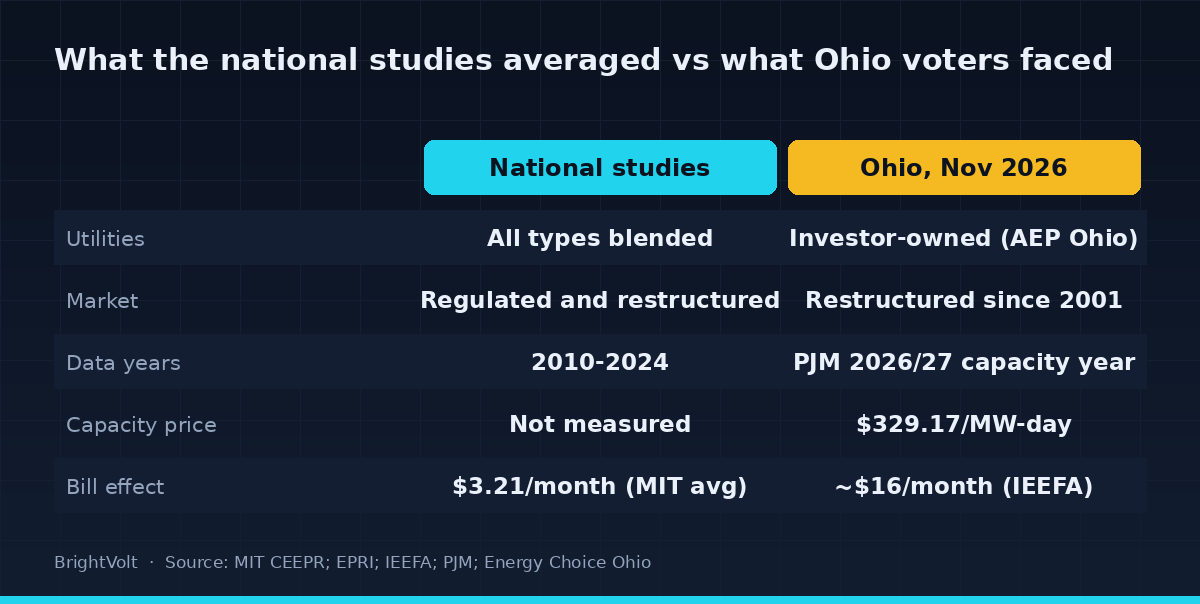
Ohio is the place where every caveat in the reassuring studies applies at once. Its generation market has been open to retail competition since 2001, which makes it a restructured state in the MIT paper’s terms. Its large distribution utilities, AEP Ohio among them, are investor-owned. And it sits inside PJM, the 13-state grid whose capacity auction ran from $28.92 per megawatt-day for 2024/25 to $329.17 for 2026/27, with PJM’s market monitor attributing 63% of one year’s increase to data-center demand, per IEEFA.
IEEFA’s estimate of what that capacity cost adds to an Ohio household’s bill is about $16 a month. That is five times the MIT paper’s national average, and roughly double its investor-owned figure. The methods differ — IEEFA traces one forward capacity price through to bills, MIT measures realised rates after a data center arrives — so the comparison is a range, not a contradiction. But it points the same way as everything else in this piece.
So the Ohio vote is not evidence that voters misread the research. It is closer to the research’s own footnote, cast in ballots. As this site noted in October, Ohio is also where regulators moved first, forcing new data centers above 25 MW onto AEP Ohio’s take-or-pay tariff. A state does not write that tariff unless it has already decided whose bill the cost was landing on.

What to watch, and what would change the read
The national studies all end in 2024 or 2025, before most of the current hyperscale wave plugs in. That is the cleanest test. If PJM’s capacity price stays near its cap and AEP Ohio’s next rate filings show residential rates rising faster than the national average, the gradient described here holds, and the average will start to creep up toward the Ohio number rather than the other way round.
What would undercut it is just as specific. If the next MIT or EPRI update, run on 2025–26 data, finds no larger effect in investor-owned PJM utilities than elsewhere, then Ohio’s vote was about water, noise and land, and the bill argument was riding along. On today’s evidence, that is the less likely result.
The honest summary of the week is not that data centers are innocent. It is that they are cheap for the average American and expensive for some particular ones, and that the particular ones just voted.
Photo by Brett Sayles on Pexels · Photo by panumas nikhomkhai on Pexels · Photo by AV on Pexels