
In August 2026, China’s new-energy vehicle sales fell for the eighth month running — down about 10% year on year — while NEV market share hit a record 65.2%. Both numbers are real, and they are not in tension once you see what each one measures. Penetration is a share of a market that is itself shrinking. Volume is the count of cars actually sold. When the market contracts faster than EV sales do, share climbs to records at the exact moment sales are falling.
This is the single most misread pair of statistics in the EV business, and the misreading runs in both directions — a record share waved around as proof of a boom, or falling sales treated as proof the transition has stalled. Usually neither is quite right. The number that tells you what is happening is the one nobody puts in the headline: what the whole market did.
Penetration and volume are not the same claim
Volume is a count. China sold 1.005 million new-energy passenger vehicles at retail in August 2026 (CPCA data). That is a hard number of cars that left dealerships, and it was down 10.1% on the same month a year earlier.
Penetration is a ratio: NEV sales divided by all passenger-vehicle sales. It answers a different question — not “how many EVs sold” but “what fraction of everything sold was electric.” The two move together only when the denominator, the total market, is stable. The moment the overall market starts moving on its own, the share and the count can part company completely, and a reader who treats them as interchangeable will draw the wrong conclusion from whichever one they happened to see.
Penetration is therefore a relative measure and volume an absolute one. A rising share does not tell you the EV business grew. It tells you EVs lost ground more slowly than everything else — which, in a falling market, is all it takes to set a record.

How China set a record while sales fell
The August 2026 figures are a clean worked example because both halves are extreme. NEV retail fell 10.1% to 1.005 million. Total passenger-car retail fell 23.6%, to 1.541 million. Gasoline-car sales, the balance, nearly halved.
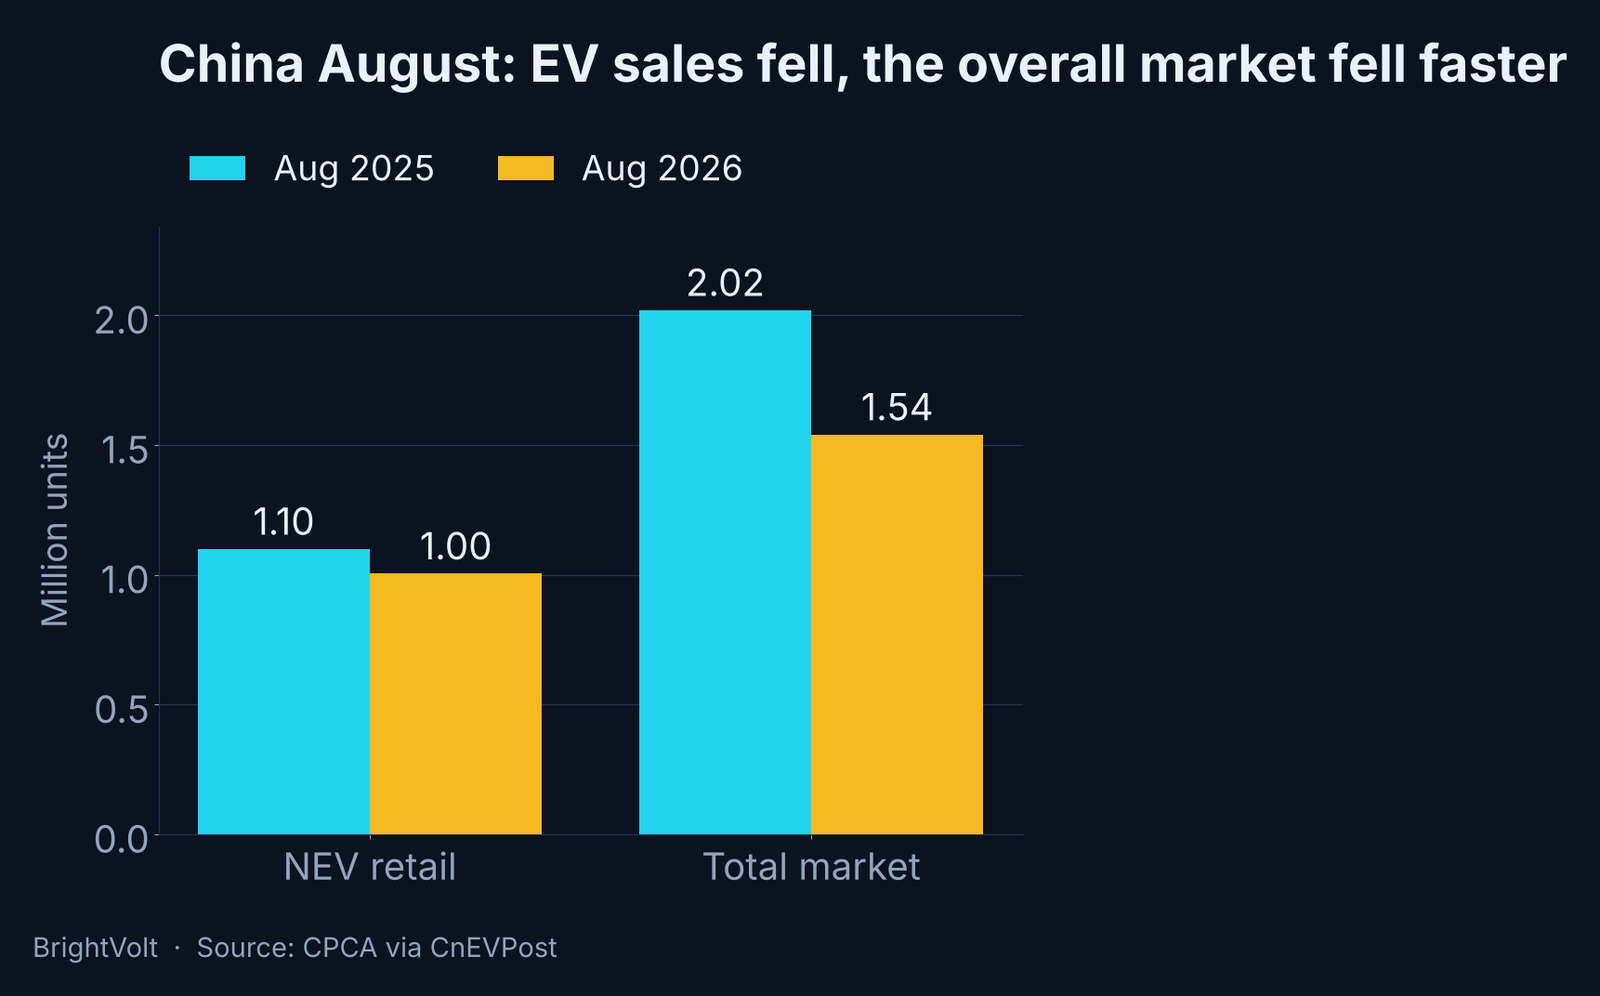
Run the division. A year earlier NEV share sat around 55%; in August 2026 it was 65.2%, up 9.9 points. Every point of that gain came from the denominator. NEV sales did not rise — they fell by a tenth. But conventional cars fell so much faster that the electric slice of a smaller pie was a bigger fraction than the electric slice of the larger pie had been. The record share is a true statement about a market in retreat, not a market in bloom.
| China, August | NEV retail | Total market | NEV share |
|---|---|---|---|
| 2025 | ~1.10 million | ~2.02 million | ~55% |
| 2026 | 1.005 million | 1.541 million | 65.2% |
That is the mechanism in one table: the middle column shrank harder than the left one, so the right column hit a record. Anyone reading only the right column would conclude China’s EV market is booming. It is doing something more interesting and more precarious — electrifying a market that is contracting underneath it.
The mirror image, and why it matters
The same arithmetic runs the other way, which is what makes it a principle rather than a China story. In the United States through 2026, battery-electric sales also fell. But the overall US car market did not collapse the way China’s did — it roughly held. So the battery-electric share fell along with the volume, instead of rising, and the US piece we wrote on the Q2 slowdown is about falling sales and a shrinking slice at the same time.
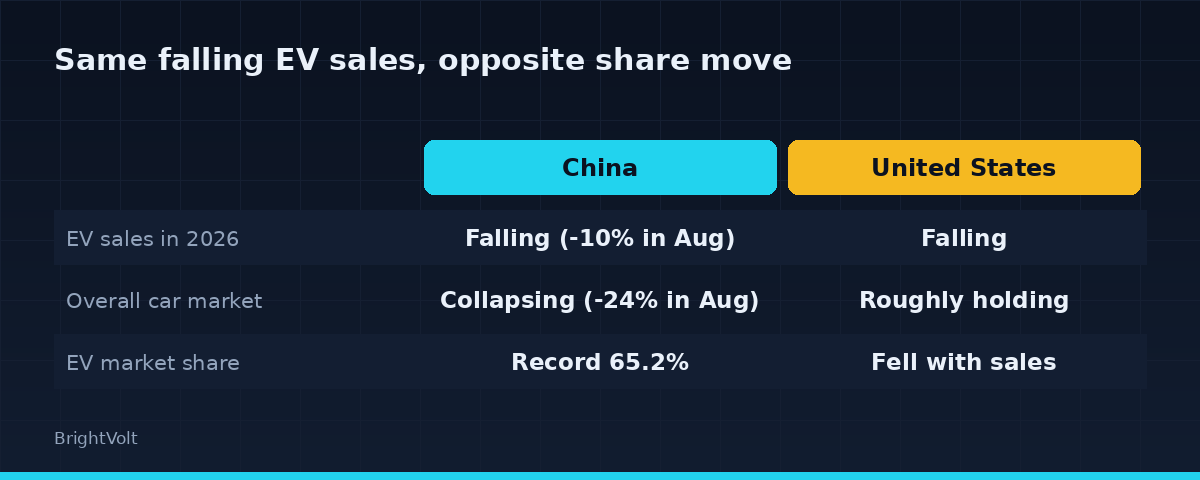
Two markets, EV sales falling in both, opposite outcomes for market share. The only variable that changed is the denominator. That is the whole point: share is a verdict on the EV market relative to the rest of the market, and you cannot read it without knowing what the rest of the market did.
How to read an “EV share hits record” headline
The practical rule is to never take a share figure on its own. Find the volume and find the total market, and the four combinations decode themselves.
| Market share | Sales volume | What it usually means |
|---|---|---|
| Up | Up | Genuine EV growth — the slice and the pie both grew |
| Up | Down | The whole market is shrinking faster than EVs (China, 2026) |
| Down | Down | EVs retreating inside a steady market (US battery-electric, 2026) |
| Down | Up | The market is growing faster than EVs can keep up with |
Only the top row is the unambiguous good-news story the headlines imply, and in a mature market it is the rarest of the four. The two middle rows are where most 2026 figures actually sit, and they look like opposites — record share versus falling share — while describing the same thing: EV sales softening against a backdrop that is moving faster in one direction or another.
There is a second trap worth flagging. Preliminary and final figures differ: CPCA’s first estimate put August NEV retail near 1.069 million before the final number came in at 1.005 million. A share built on a preliminary count can move when the count is revised. When a record is announced within days of the month closing, it is provisional — worth noting, not worth building a thesis on.
None of this means penetration is a useless number. It is the right measure for how far a market has electrified, and China at 65% is genuinely a different place from the US in the single digits. It is simply not a measure of whether the EV business is growing. For that, read the volume — and then read what the whole market did, because the share will not tell you on its own.
Photo by I’m Zion on Pexels · Photo by Luke Miller on Pexels