
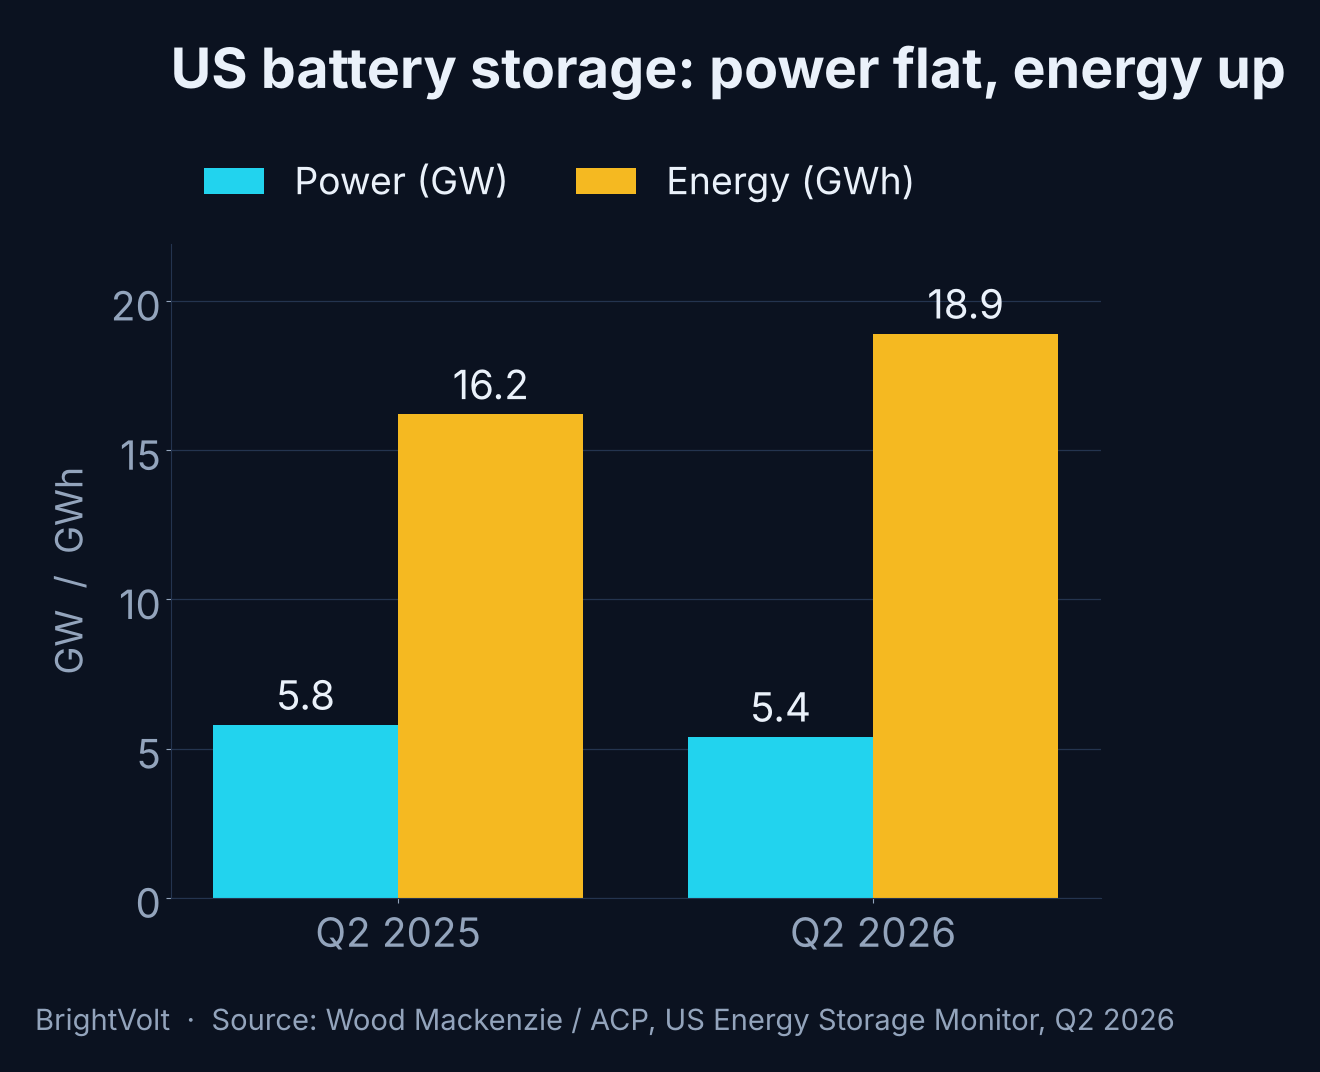
The United States installed a record 18.9 gigawatt-hours of battery storage in the second quarter of 2026 — and 7% less power than it did a year earlier. Both figures come from the same Wood Mackenzie and American Clean Power report, and both are true, because they measure different things. The fleet added duration, not capacity. For a grid that has to keep the lights on through the next supply crunch, that is not the same win the headline implies.
The number everyone repeated was the 18.9 GWh. It is the wrong one to celebrate.
A record measured in the metric that was rising anyway
Power and energy are not interchangeable, and a battery is rated for both. Power — the gigawatts — is how hard it can push at any instant. Energy — the gigawatt-hours — is how much it holds in total. Divide one by the other and you get duration, the number of hours a battery can sustain full output. We have an explainer on exactly this distinction, because it is the single most reliable way to misread a storage statistic.
Q2 is a case study. Installed power came in at 5.4 GW, down 7% on the 5.8 GW of a year earlier. Installed energy rose to 18.9 GWh, up roughly 17%. The arithmetic forces the conclusion: the average new system went from about 2.8 hours of duration to 3.5. Wood Mackenzie’s own headline says as much — “longer-duration systems drive growth.” The record is real. It is a record in stamina, and the press wrote it up as a record in scale.
This is the grid-scale mirror of something we flagged at the other end of the market. US home batteries have been getting more muscle and no more storage — more kilowatts, the same kilowatt-hours. The utility fleet is doing the reverse: more hours, fewer gigawatts. Neither is “more batteries.” Both get flattened into a single word, “boom,” that hides which way the dial actually moved.
Why the hours went up and the gigawatts didn’t
Three things pulled duration up at once, and none of them is an accident.
Developers are building longer systems on purpose. A two-hour battery can arbitrage the morning-to-evening price spread; it cannot cover a five-hour evening ramp on a grid where solar has already eaten the afternoon. California’s new projects skew toward four hours and beyond for precisely that reason, and the long-duration tier — the multi-day chemistries that finally found a buyer in AI data centers — stretches the average further still. Longer is, in most respects, the right direction.
The gigawatts tell the quieter story. Utility-scale power installations, which are 87% of the fleet, actually fell 8% year on year to 4.7 GW as the largest markets near saturation. Texas and California have been absorbing batteries at a pace they cannot indefinitely sustain, and the pipeline behind them is not yet replacing the volume at the front. Prices drifted down to $916 per kilowatt, about 2% cheaper than a year ago, which should have made power more affordable to add, not less. It did not show up as more gigawatts.
| Segment | Power, Q2 2026 | Energy | Power, year on year |
|---|---|---|---|
| Utility-scale | 4.7 GW | 17.6 GWh | −8% |
| Residential | 0.68 GW | — | +3% (−15% on Q1) |
| Community & C&I | 0.05 GW | — | −2% |
| Total | 5.4 GW | 18.9 GWh | −7% |
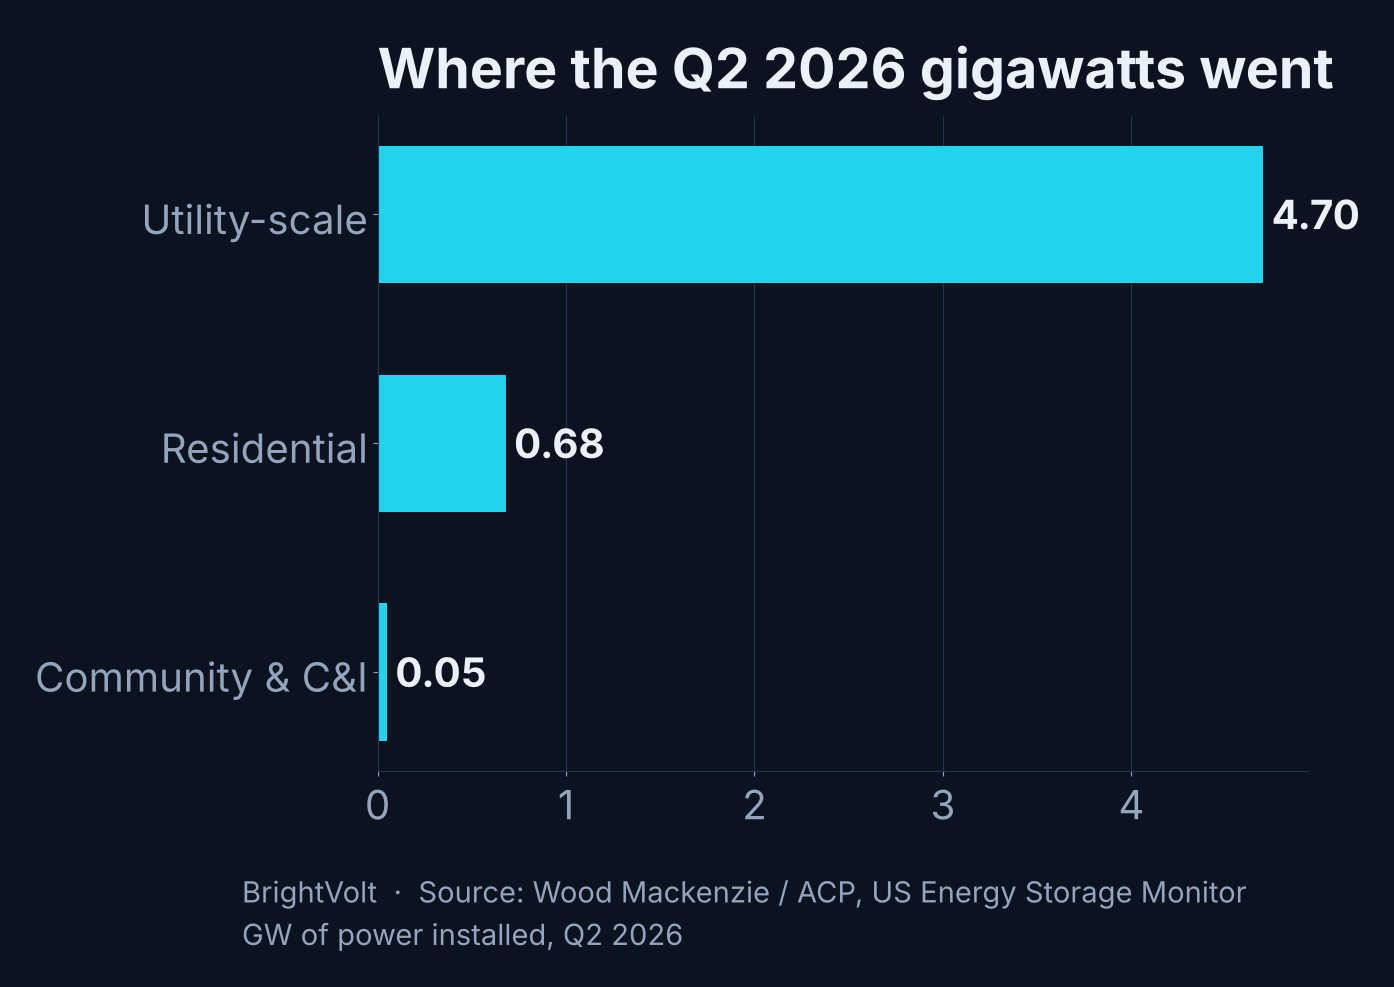
Read the table and the “record” shrinks to one segment doing one thing: utility-scale developers building fewer, longer batteries. That is a legitimate strategy. It is not the broad-based acceleration a 20-site news cycle described.
What the grid actually calls for
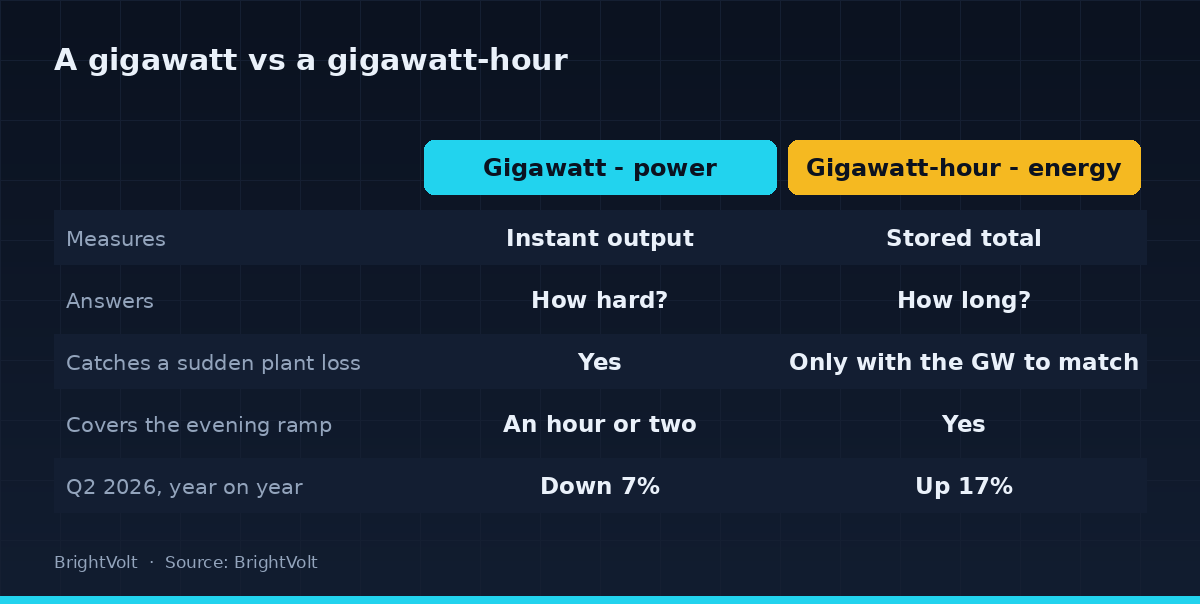
Here is the strongest version of the other side, because it deserves one. A high-renewables grid is duration-constrained, not power-constrained. The binding problem on a sunny, over-supplied afternoon is not instantaneous output — there is plenty — it is having enough stored energy to carry the evening after the sun drops. On that view, gigawatt-hours are the metric that matters and a plateau in gigawatts is a sign of a maturing market finding the right system size, not a weakness.
It holds, right up to the moment the grid is actually under stress. The events that threaten the lights are power events. A generator trips, a heatwave drives demand past forecast, an interconnector fails — and the grid needs megawatts now, for a few hours, not a reservoir it can only empty slowly. California just had two of those evenings. On 5 and 6 October, CAISO called emergency dispatches when day-ahead prices blew past $200 per megawatt-hour, and the thing it reached for was peak power from the home-battery fleet, measured in megawatts, not stored energy. A bigger reservoir with the same-sized tap does not help in that minute.
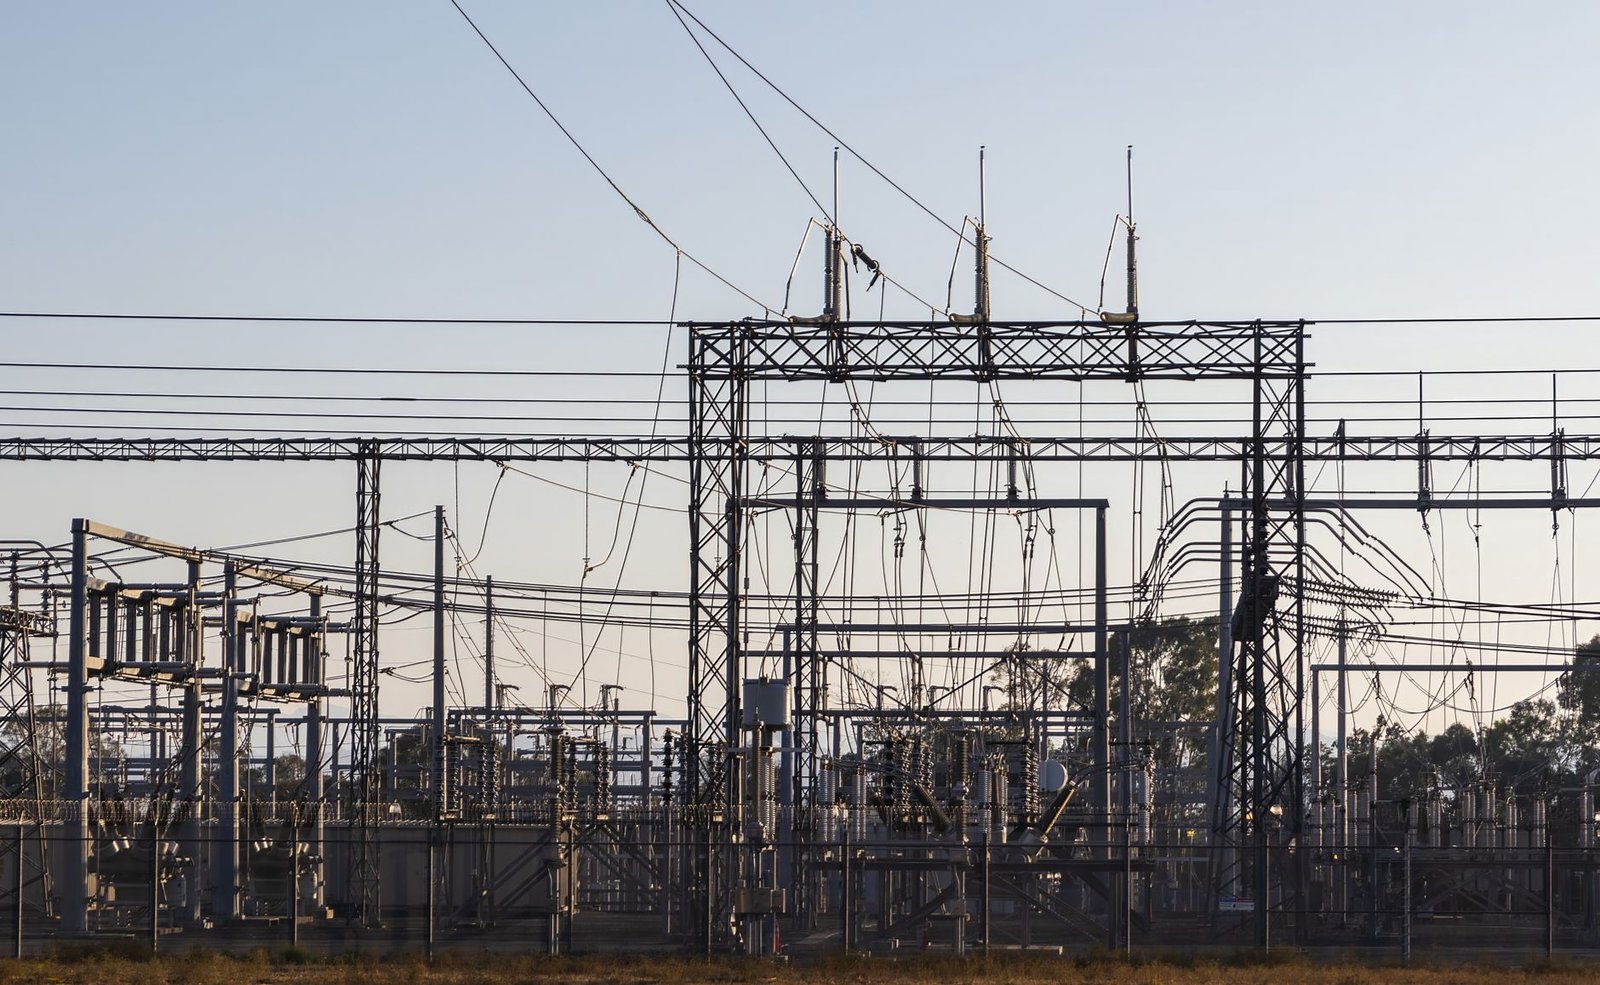
So the honest read is the boring one in the middle of two loud ones. Duration is going up because a solar-heavy grid needs it, and that is good. Installed power is flatlining because the biggest markets are full and the next ones are slow, and that is a problem the GWh record conveniently obscures. Celebrating the stored energy while the deliverable power stalls is how a grid talks itself into feeling firmer than it is.
What would change our mind
This read is falsifiable, which is the point. If Q3 and Q4 show installed power (the gigawatts) resuming growth rather than the GWh total climbing on duration alone, the “capacity plateau” concern was a one-quarter artifact of saturated markets, and we will say so. Wood Mackenzie’s own forecast does not obviously help its headline here: 207 GW and 715 GWh of cumulative installations by 2031 works out to an average duration of about 3.5 hours — flat at today’s level. If duration is already where the market wants it, then future growth has to come from gigawatts, and gigawatts are the number that just went backwards.
Watch the power column, not the energy one. The record that matters is the next quarter the US adds more gigawatts than the quarter before — and Q2 was not it.
Photo by Heru Dharma on Pexels · Photo by Robert So on Pexels