
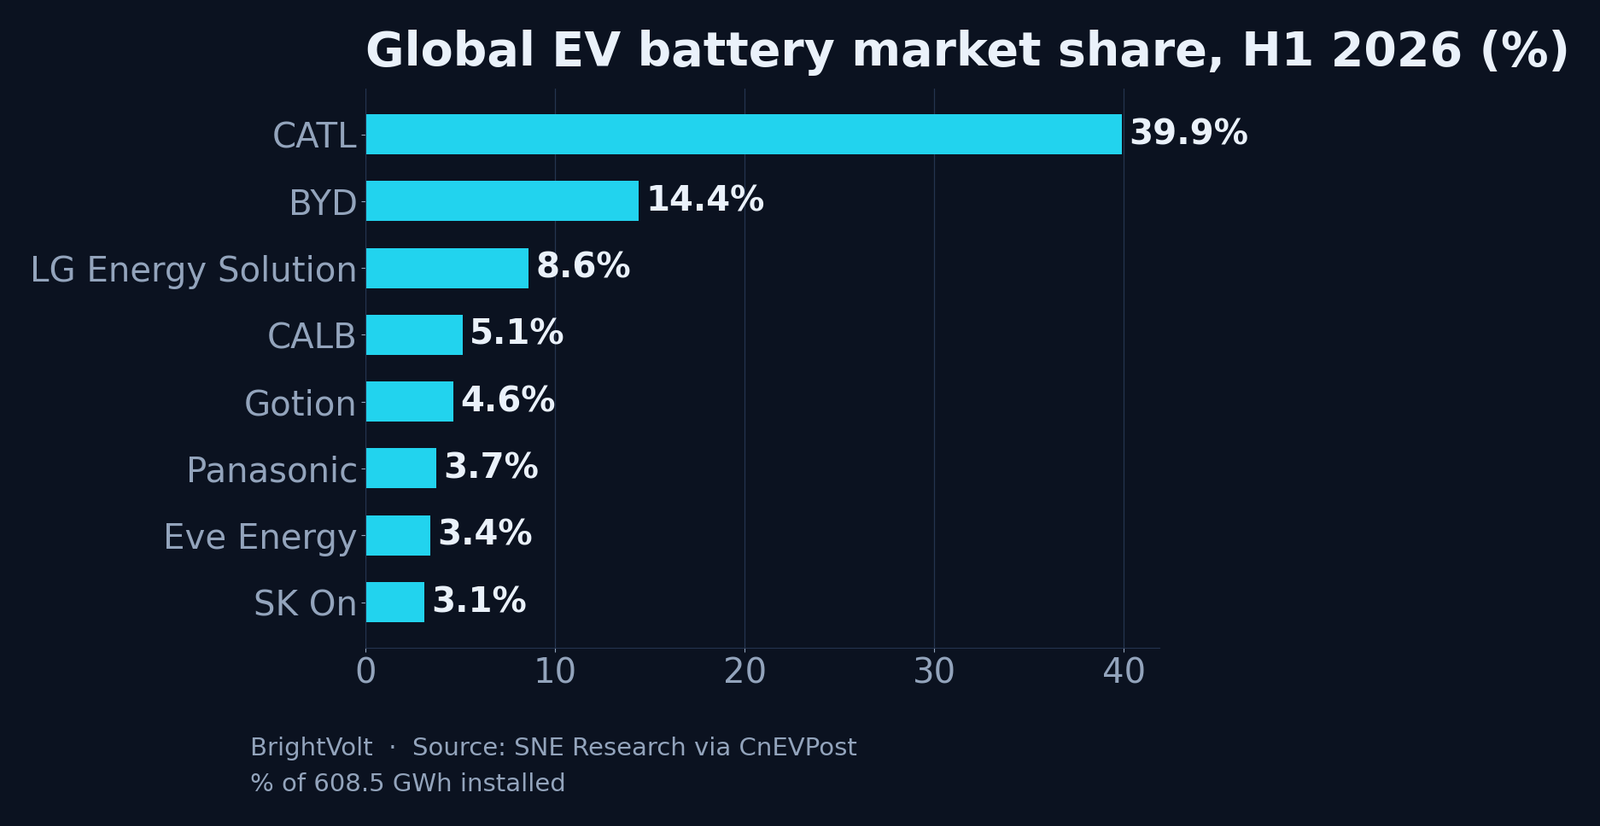
CATL supplied 39.9% of the world’s electric-vehicle batteries in the first half of 2026 and does not build a single car. BYD supplied 14.4% and put almost all of them in its own vehicles. That one difference — merchant versus captive — decides what a battery maker’s market share is actually telling you, and it is the reason two companies with similar-sounding numbers are in completely different businesses.
The figures come from SNE Research’s half-year tally, reported by CnEVPost: global EV battery usage reached 608.5 GWh in H1 2026, up 20% year on year. CATL installed 242.7 GWh of that; BYD installed 87.7 GWh. Read as a league table it looks like a simple ranking of who makes the best cells. It isn’t. It is two different questions wearing the same percentage sign.
Merchant and captive: who a cell maker sells to
A merchant supplier sells cells to anyone who will buy them. CATL is the purest example — its packs go into Teslas, Fords, Volkswagens, Hyundais, BMWs and dozens of Chinese brands, none of which it owns. Its fortunes rise and fall with the whole EV market, because it is selling to the whole EV market.
A captive supplier makes cells mainly to feed its own products. BYD is the textbook case: it is a carmaker that happens to run one of the planet’s largest battery operations, and the overwhelming majority of its cells go into BYD cars. Panasonic spent years in a similar position, its battery business bolted tightly to Tesla’s demand. Tesla’s own 4680 line is captive by definition. The cells can be excellent; the business is still structurally different from CATL’s.
Why a captive maker’s “share” is really its parent’s sales
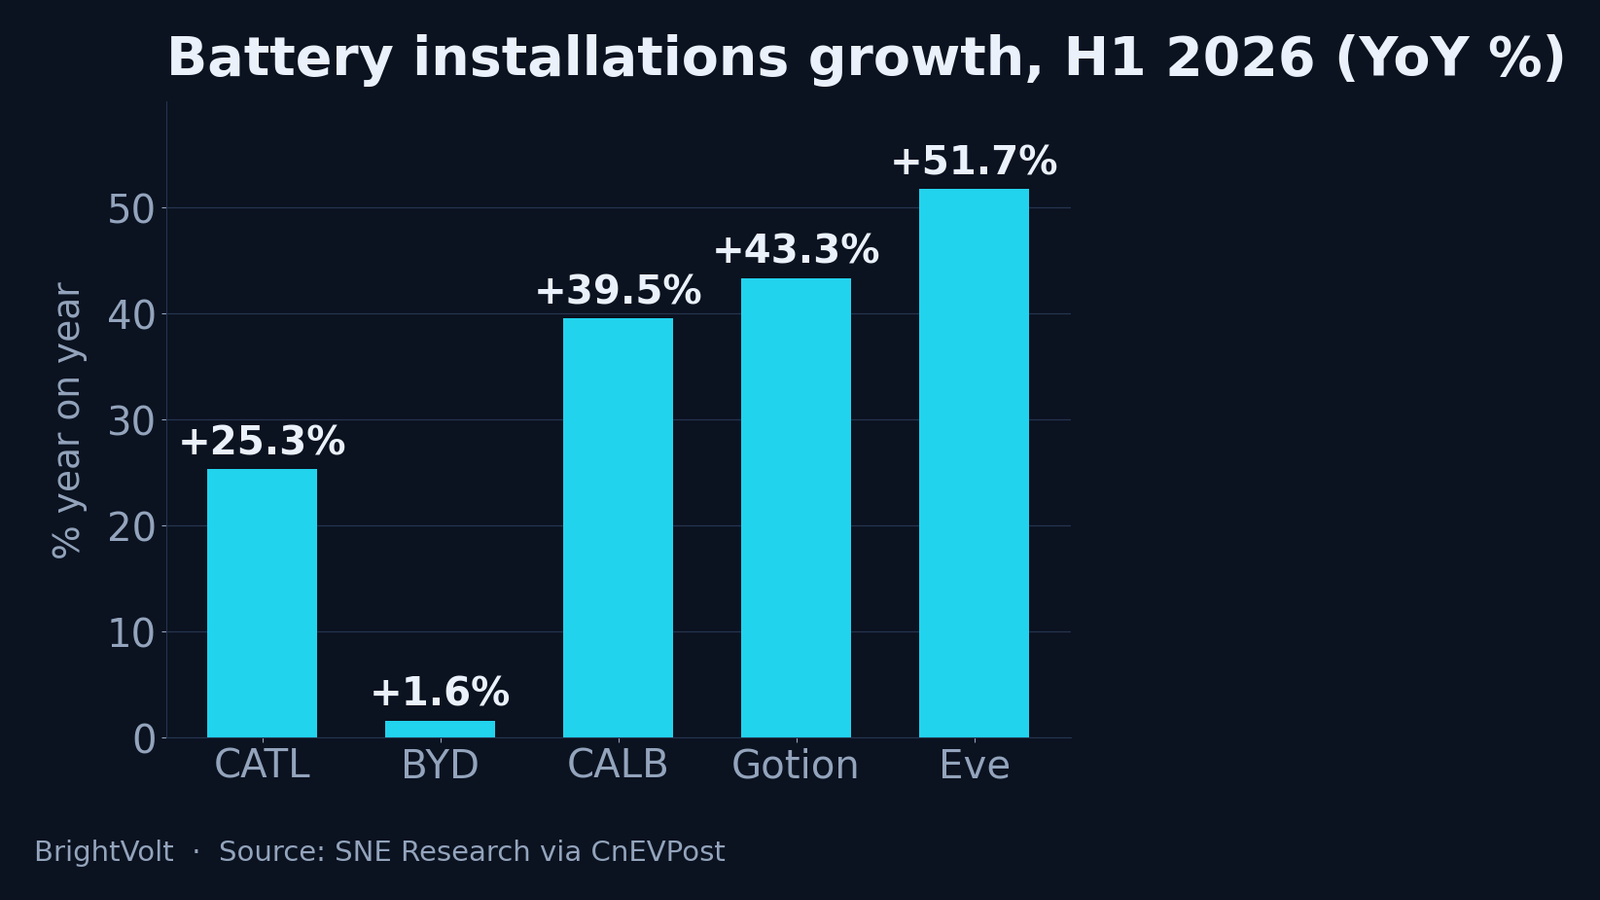
Here is the tell. In H1 2026 CATL’s installations grew 25.3% year on year, tracking a market that grew 20%. BYD’s grew just 1.6%. That is not a story about cell chemistry. BYD’s battery output can only grow about as fast as BYD sells cars, and its vehicle growth cooled — so its battery share slid from around 17–18% across 2024 and 2025 to 14.4%, even as its cells stayed competitive. A captive supplier’s market share is a proxy for its parent’s showroom, nothing more.
CATL has the opposite exposure. It does not need any single carmaker to win; it needs the category to grow, and it can pick up a customer its rival just lost. That is why the top of the table is stable while the middle churns. The challengers climbing fastest — CALB up 39.5%, Gotion up 43.3%, Eve up 51.7% — are all merchants winning new contracts, not carmakers selling more of their own cars.
| Maker | H1 2026 share | Installed | Growth (YoY) | Model |
|---|---|---|---|---|
| CATL | 39.9% | 242.7 GWh | +25.3% | Merchant |
| BYD | 14.4% | 87.7 GWh | +1.6% | Mostly captive |
| LG Energy Solution | 8.6% | 52.6 GWh | +8.4% | Merchant |
| CALB | 5.1% | 31.2 GWh | +39.5% | Merchant |
| Gotion High-tech | 4.6% | 28.0 GWh | +43.3% | Merchant |
| Panasonic | 3.7% | 22.7 GWh | +10.2% | Largely captive |
| Eve Energy | 3.4% | 20.9 GWh | +51.7% | Merchant |
| SK On | 3.1% | 19.0 GWh | −6.7% | Merchant |
The ceiling — and why carmakers build captive supply anyway
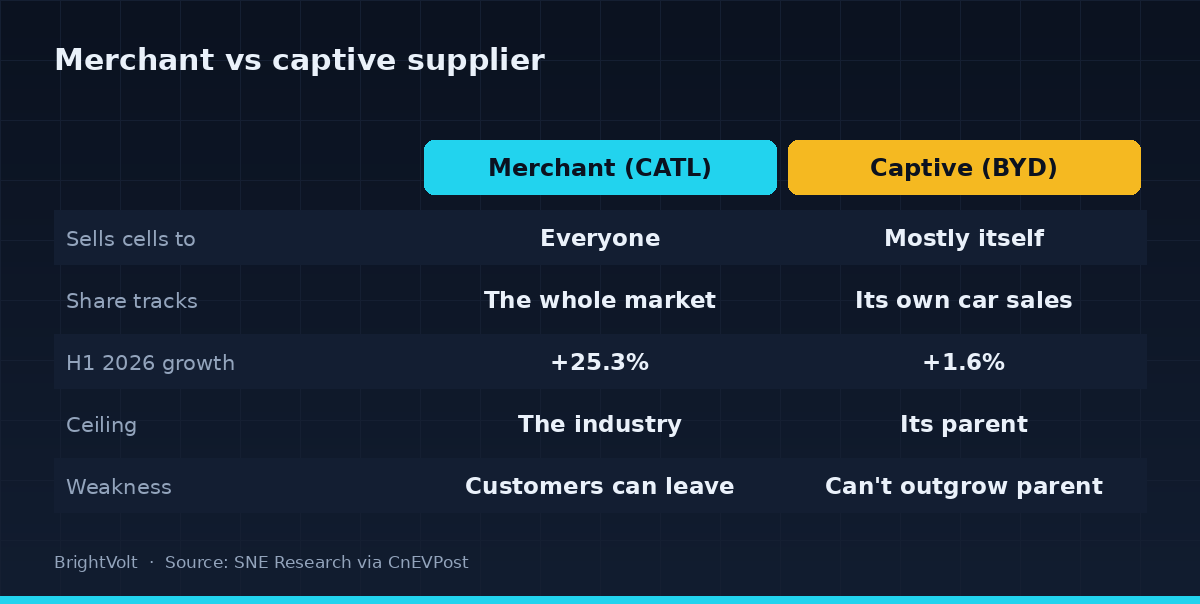
A captive supplier cannot outgrow its parent. That is the whole limitation in one sentence. So why would any carmaker choose it? Cost, for one: an in-house cell skips a supplier’s margin. Security, for another: nobody wants their entire model line hostage to a rival’s factory. And differentiation — if the battery is the product, owning it lets you tune range, charging speed and cost in ways a catalogue cell won’t.
That calculation is playing out right now. Li Auto is shifting its whole lineup to in-house 5C cells and winding down its reliance on CATL, joining Xpeng and Nio in bringing cells home — part of the same in-housing wave that is reshaping who CATL’s customers are. Each of them is choosing the captive ceiling on purpose, betting that control is worth more than scale.
But watch what those same companies do next, because it is the giveaway. Li Auto, Nio and Xpeng are now pursuing outside revenue from their technology — trying to sell cells and platforms to other makers. That is a captive supplier reaching for the merchant model to escape its own ceiling. BYD does the same from the other direction, quietly selling cells to Tesla and Toyota so its battery arm can grow faster than its cars. The two models are not a fixed identity; they are a strategy companies move between.
What it changes about reading the numbers
The practical habit is simple: before you rank battery makers, ask who each one sells to. CATL’s 39.9% is competitive breadth across a hundred customers. BYD’s 14.4% is mostly BYD’s own sales counted twice — once as cars, once as cells. They are not comparable measures of who makes the better battery, and every “CATL versus BYD” headline that treats them as such is comparing a supplier to a showroom.
It also shifts by market. In grid storage — the other half of the cell business — CATL held 27.1% in H1 2026, well below its EV share, because stationary-storage buyers are a different, more fragmented crowd. A maker’s merchant reach is not one number; it is one per market it chooses to serve. This is the same reason the chemistry a maker bets on matters less to its share than the customers it can reach with it.
So the number to watch over the next year is not CATL’s headline percentage, which will drift with the market. It is whether Li Auto, Xpeng and Nio actually sell cells outside their own cars — the test of whether a captive maker can break its ceiling — and whether BYD’s external sales start to lift its share independently of how many cars it moves. Those are the moments a percentage stops being a proxy for a showroom and starts meaning what everyone already assumes it means.
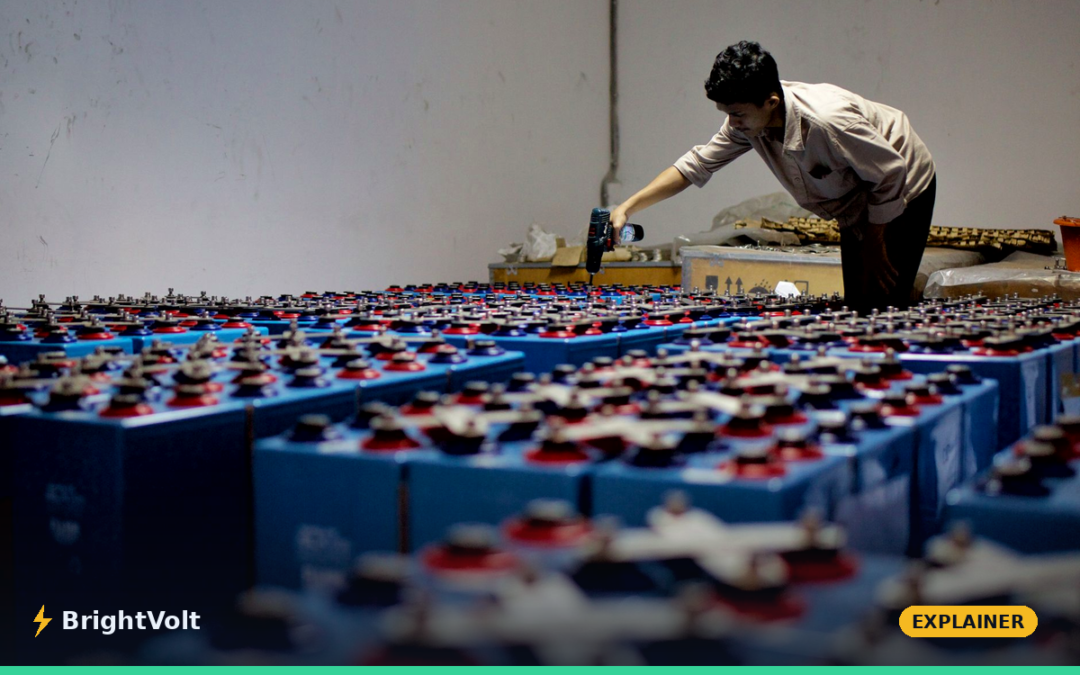
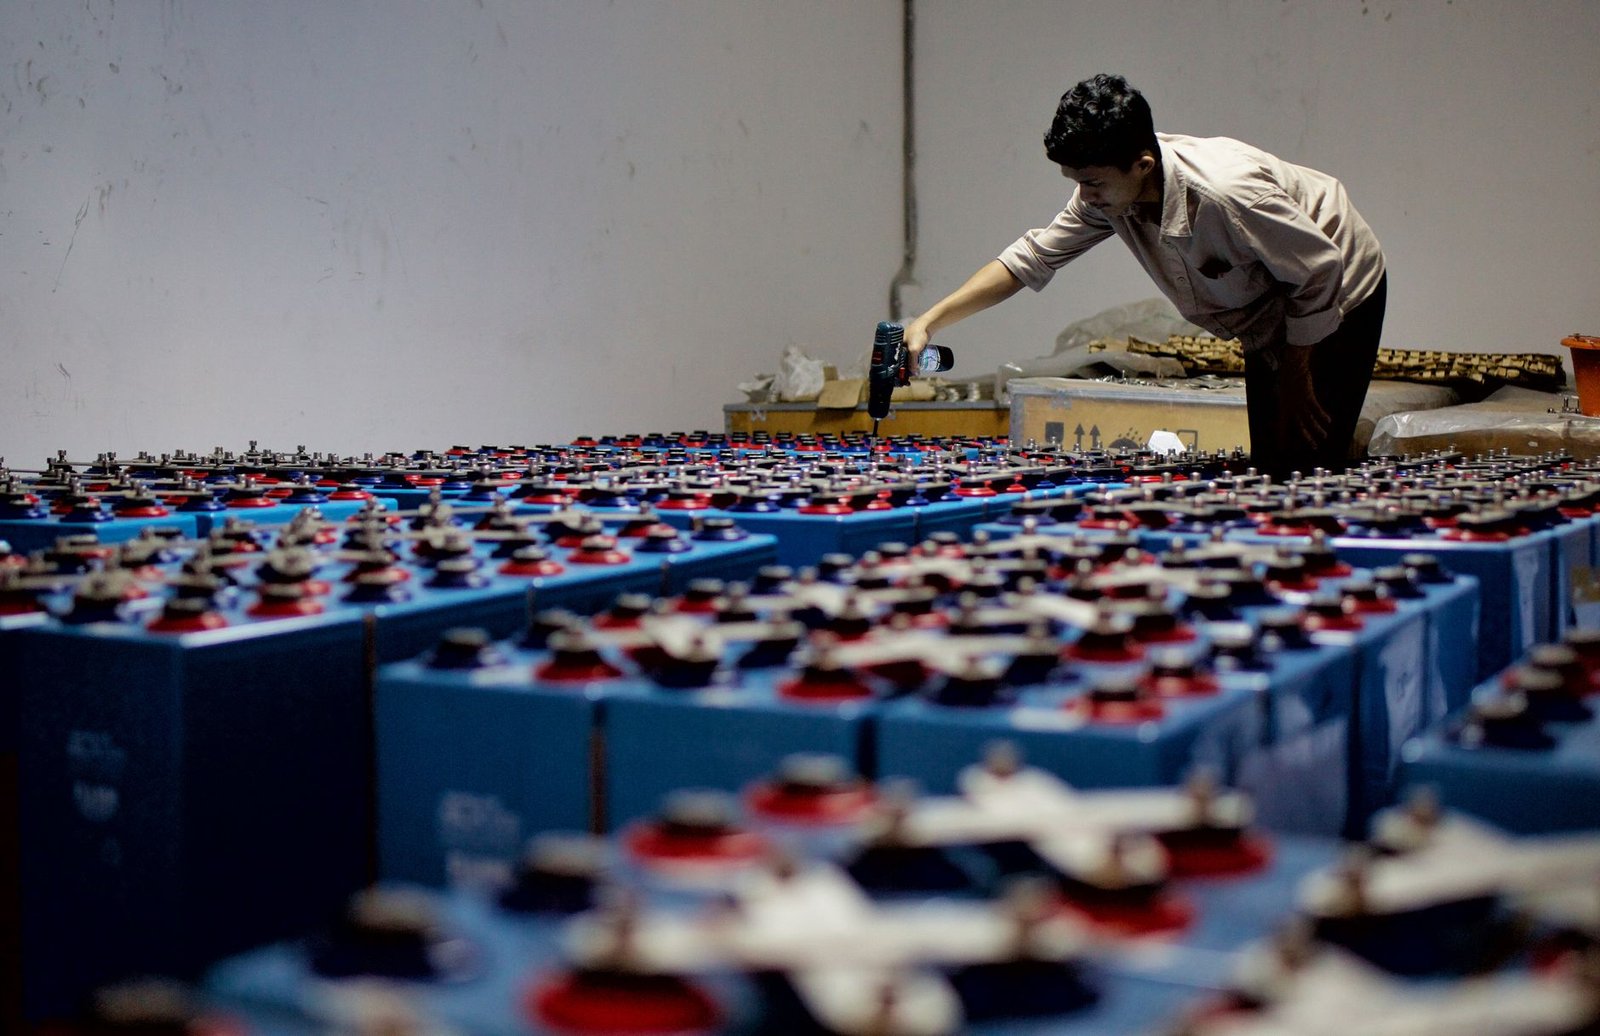
Photo by Heru Dharma on Pexels · Photo by Heru Dharma on Pexels