
In the United States the wait to plug a power plant into the grid is now longer than the time it takes to build one. Roughly 2,000 gigawatts of generation and storage — more than the entire installed US power fleet — sits in interconnection queues, and of every project that has ever joined one, only about 13% reached operation. The panel is not the bottleneck. The line to connect it is.
This is the single most important fact about American clean energy that almost nobody outside the industry has heard, because the only places that explain it are federal dockets and national-lab PDFs. Here is what an interconnection queue is, why it moves so slowly, and why one state escapes it.
What an interconnection queue actually is
It is the line a new power plant joins to earn permission to connect to the grid — and to find out who pays for the wires. Before a solar farm, wind farm or battery can send a single electron anywhere, the regional grid operator has to study what the new plant does to the network: whether it destabilises voltage, whether the existing lines can carry the extra power, and what upgrades the connection will require. That study, and the queue of projects waiting for it, is the interconnection process.
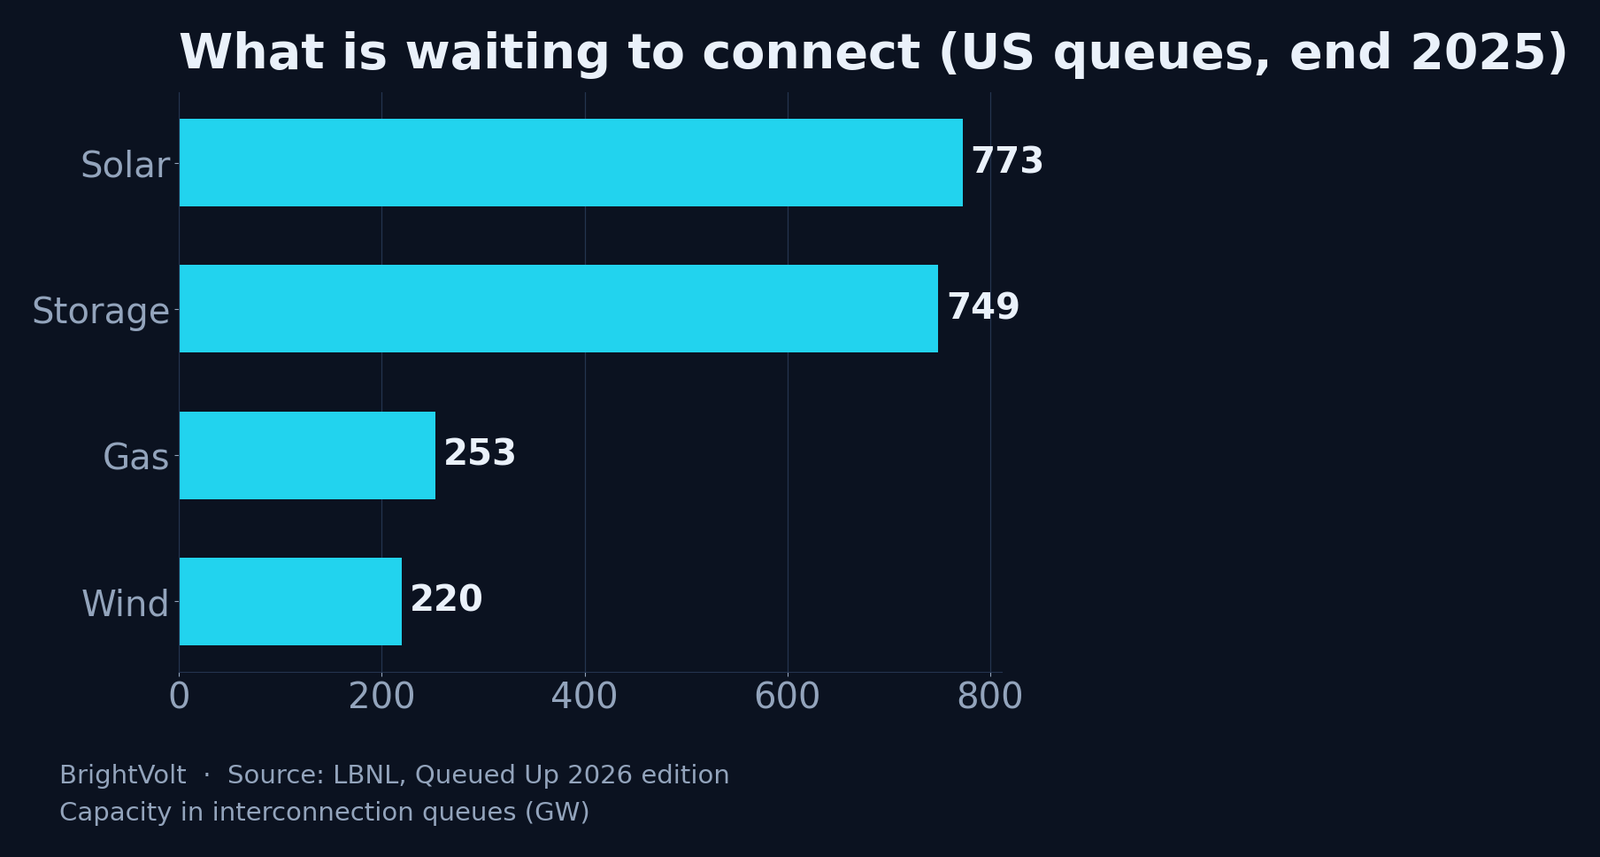
The scale of the waiting room is the story. At the end of 2025, about 8,200 projects were actively seeking connection, representing 1,312 GW of generation and roughly 749 GW of storage, according to Lawrence Berkeley National Laboratory’s annual Queued Up survey. Two technologies dominate the pile: solar at 773 GW and batteries at 749 GW, with wind at 220 GW and natural gas at 253 GW. For scale, the entire US generating fleet is a little over 1,200 GW. The country has more clean power waiting for a grid connection than it has power plants.
Why the line moves so slowly
The old process studied projects one at a time, first-come-first-served, and that design is most of the problem. Each study assumed every project ahead of it in the queue would get built. When one of those dropped out — and most do — the network calculations changed, and every project behind it had to be studied again. A queue built on serial restudies grinds: the median time from request to commercial operation was over five years for projects that came online in 2025, up from under two years a decade earlier.
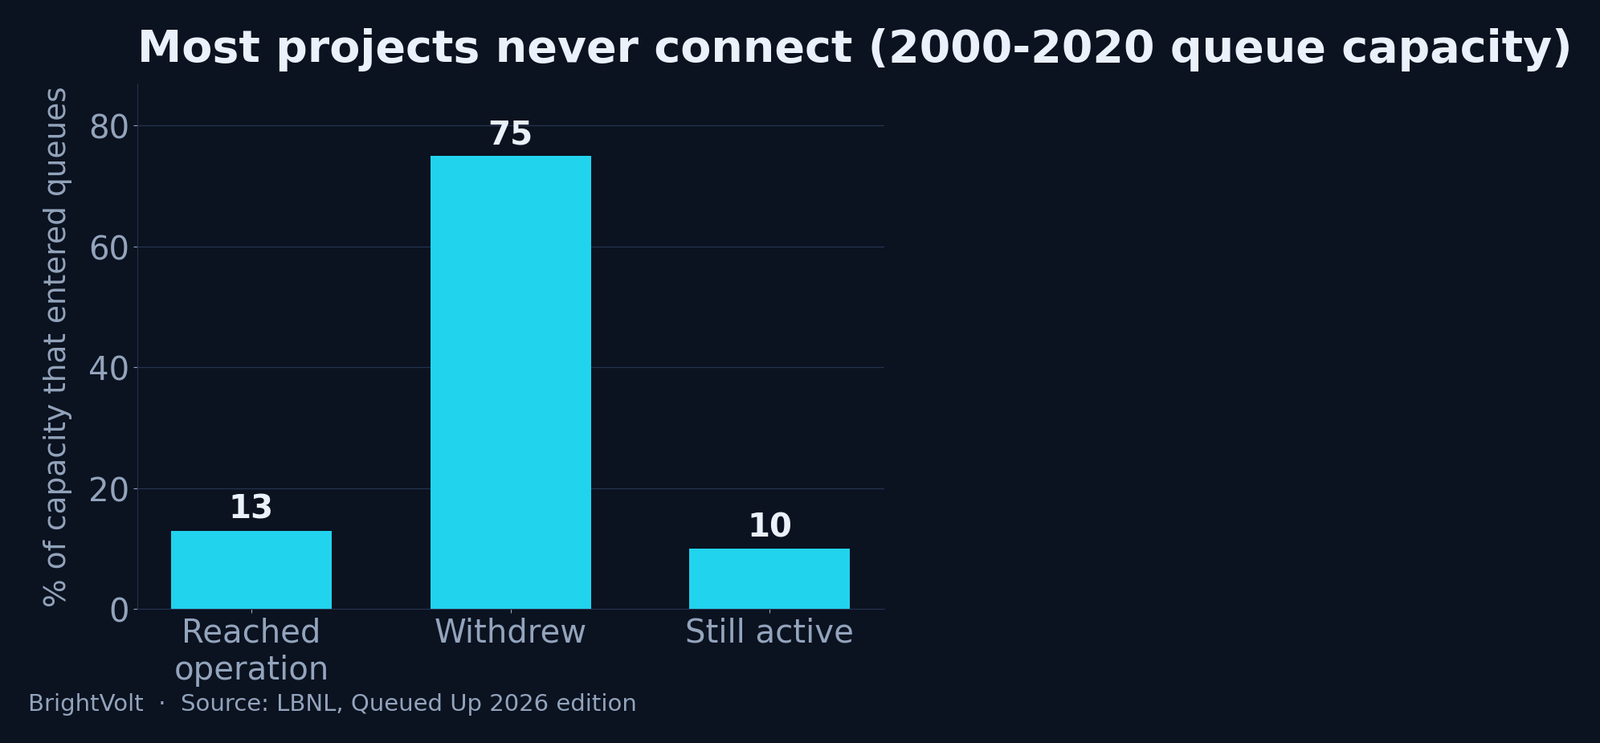
Most projects never finish at all. Of all the capacity that entered queues between 2000 and 2020, just 13% had reached commercial operation by the end of 2025; 75% withdrew, and the rest is still waiting. That is the number that reframes every headline about gigawatts “in the pipeline.” A pipeline where seven of every eight gigawatts never arrives is not a pipeline. It is a waiting room with a very high mortality rate.
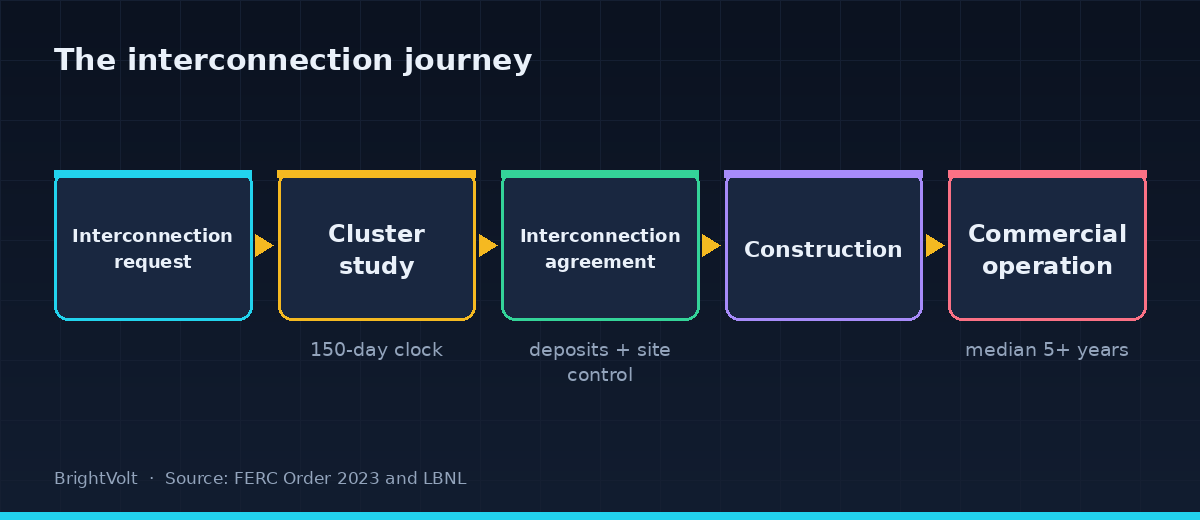
The journey a surviving project takes explains where the years go.
The Texas exception
One grid runs on a different rule, and it shows. Texas, whose ERCOT grid is not under federal jurisdiction, uses a model called “connect-and-manage”: a project connects quickly, and if the grid is congested, the operator curtails it until upgrades catch up. Everywhere else, the developer must prove the network can absorb the power before connecting — and pay for the upgrades that proof identifies.
The difference in speed is enormous, and it is why Texas builds utility-scale solar in months while other markets count years. Connect-and-manage is not free — it accepts some curtailment and pushes network reinforcement into the future — but it inverts the burden. One model asks a project to wait until the grid is certainly ready; the other lets it connect and manages the risk afterwards.
| How a project connects | Study-based (most of the US) | Connect-and-manage (ERCOT) |
|---|---|---|
| Grid readiness | Proven before connection | Managed after connection |
| Who bears the delay | The developer, in the queue | The grid, through curtailment |
| Typical time to connect | 5+ years | Months to ~2 years |
| Cost of network upgrades | Assigned up front, can kill a project | Deferred and shared |
| Trade-off | Certainty, at the price of speed | Speed, at the price of some curtailment |
What FERC changed, and what it didn’t
The federal regulator saw the gridlock coming. FERC Order No. 2023, effective November 2023, scrapped the serial first-come-first-served model for a “cluster study” approach: batch the requests, study them together on a 150-day clock, and stop restudying the whole line every time one project leaves. It paired that with teeth — commercial-readiness deposits, a requirement to control 90% of the project site at application, and financial penalties for developers who withdraw late. The target was the speculative flood: at the end of 2022, more than 2,000 GW sat in queues and 68% of the studies completed that year were late.
What the reform cannot do is conjure wires. Cluster studies clear the paperwork faster, and the deposits should thin the speculative projects that clog the count. But the physical constraint underneath the queue is the same one throttling the rest of the grid: not enough high-voltage transmission, and a transformer shortage that is already the binding limit on new connections. A faster queue that leads to the same overloaded network is a shorter line to the same locked door.
So watch two numbers to know whether the fix is working. First, the withdrawal rate: if it falls, the readiness deposits are filtering speculation as intended. Second, the storage share, which keeps climbing because batteries often need fewer network upgrades to connect and so move through faster than a distant wind farm. If median wait times drop below three years without a wave of new transmission, the queue was mostly administrative and the reform will have fixed it. If they don’t, the bottleneck was never the study. It was the grid.
Photo by Robert So on Pexels · Photo by Petr Ganaj on Pexels