
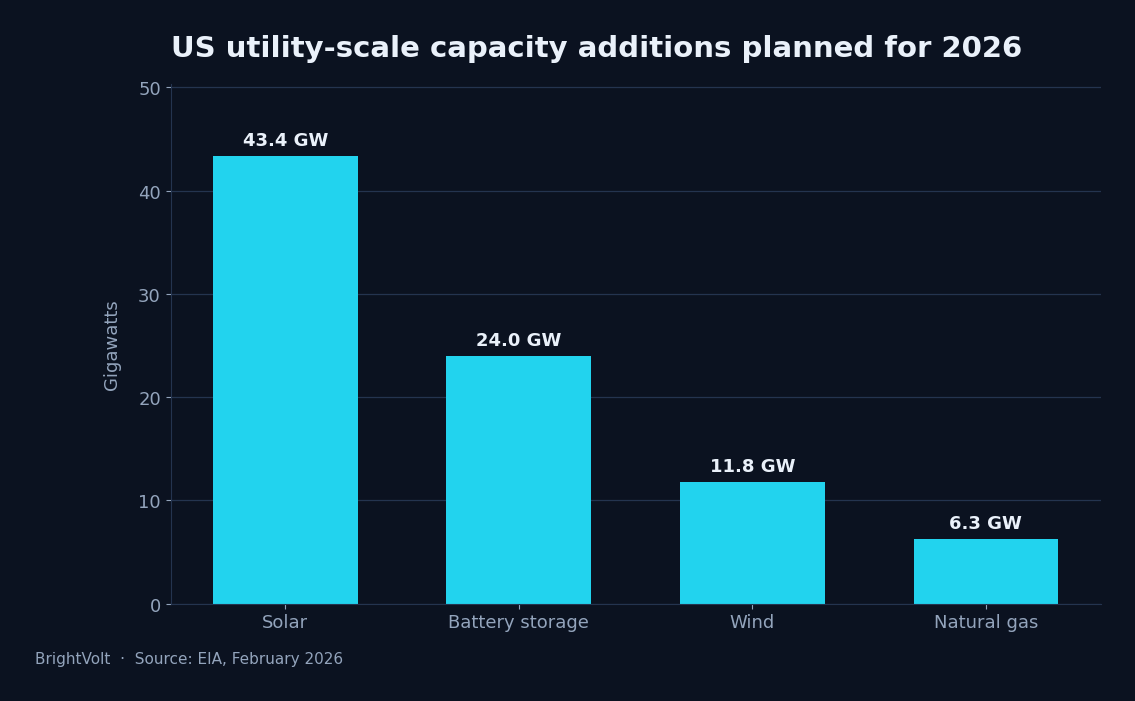
Solar and battery storage account for 79% of every gigawatt the United States expects to add to its grid this year. The Energy Information Administration projects 86 GW of new utility-scale generating capacity in 2026 — a record if it lands — of which solar contributes 43.4 GW and storage 24 GW. Natural gas contributes 6.3 GW, or roughly one gigawatt in every fourteen.
The mix has stopped being a competition
For most of the past two decades, “what is the grid building” was a live question with several plausible answers. It isn’t any more. Solar alone is more than half of this year’s additions at 51%, storage is 28%, wind adds 11.8 GW for 14%, and gas rounds out the remainder at 7%.
What makes the gas figure striking is not that it is small but that it is small while electricity demand is climbing at the fastest rate in decades. If rising load were straightforwardly good for thermal generation, 2026 would be the year that showed it. Instead the response to demand growth is being met overwhelmingly by panels and cells.
The reason is schedule and modularity rather than ideology. A solar array can be phased into service as sections energise; a combined-cycle plant delivers nothing until it delivers everything. When a utility is trying to meet load that is arriving faster than it can plan for, capacity that can be added in increments is worth a premium.

Storage is the number that changed
The solar figure is a continuation. The storage figure is not.
Battery storage additions are projected at 24 GW this year against 15 GW in 2025, which was itself the previous record. To put that in context, more than 40 GW of storage has been added across the past five years in total — meaning 2026 alone accounts for well over a third of everything built in that period.
| Technology | 2026 planned | Share | 2025 actual |
|---|---|---|---|
| Solar | 43.4 GW | 51% | 27.2 GW |
| Battery storage | 24 GW | 28% | 15 GW |
| Wind | 11.8 GW | 14% | — |
| Natural gas | 6.3 GW | 7% | — |
| Total | 86 GW | 100% | 53 GW |
Storage is what converts solar from an energy source into a capacity resource. A gigawatt of panels cannot be relied on at 7pm; a gigawatt of panels paired with storage largely can. The pairing is why the two numbers move together, and why treating them as separate line items understates what is actually being built.
Note also the direction of travel in solar itself: 30.8 GW in 2024, 27.2 GW in 2025, and 43.4 GW planned for 2026. Last year was a dip, not a plateau.
Planned is not built
The EIA’s figure is what developers have told it they intend to energise this year, and intentions have a well-documented habit of slipping. Interconnection studies overrun, transformers and high-voltage equipment remain on long lead times, and a project that misses a commissioning window by a quarter moves into next year’s statistics rather than this year’s.
The 2025 comparison is instructive here. That year delivered 53 GW and was described as the largest single year since 2002 — genuinely large, and still well short of the 86 GW now planned for 2026. Expecting a 62% jump in a single year requires the delivery machinery to work better than it has recently.
There is a reasonable case that some of this is pull-forward rather than growth. Where tax credit eligibility depends on construction start or in-service dates, developers rationally compress timelines to land on the right side of a deadline. That inflates one year at the expense of the next, and it looks identical to acceleration until the following year’s figures arrive.
What to watch
The honest test is not whether 86 GW is announced but whether it is energised. If actual 2026 additions land near 70 GW or above, the delivery system is genuinely scaling and the mix shift is structural. If they land closer to 55 GW, the story is that developer intentions have decoupled from grid throughput — which points back at the interconnection bottleneck we argued is the binding constraint rather than at any shortage of projects.
The second thing worth watching is whether gas additions stay near 7%. If demand growth continues and that share climbs materially in 2027 planning data, it would suggest the modularity advantage is being outweighed by the need for firm capacity — and that the current mix reflects what can be connected quickly rather than what utilities would choose if the queue moved faster.
Photo by Ramesh Kambattan on Pexels · Photo by Tom Fisk on Pexels