
Australia connected a record 9.1 gigawatts of new clean generation and storage in the year to June 2026, more than double the year before. Just 0.2 GW of it was wind. That one number is why the country’s target of 82% renewable electricity by 2030 — a target AEMO says needs 18 GW of new wind — is quietly slipping out of reach. The record year is not the good news. It is the shape of the miss.
What a record year actually looked like
The connections scorecard the Australian Energy Market Operator released on 24 August is, on its face, a triumph. A record 9.1 GW reached full output across 34 projects in FY26, “more than double the result achieved in FY25,” in the words of AEMO’s connections manager Margarida Pimentel. Storage alone accounted for 12.9 GWh. The pipeline of projects seeking connection swelled 42% in a year, from 53 GW to 75.4 GW.
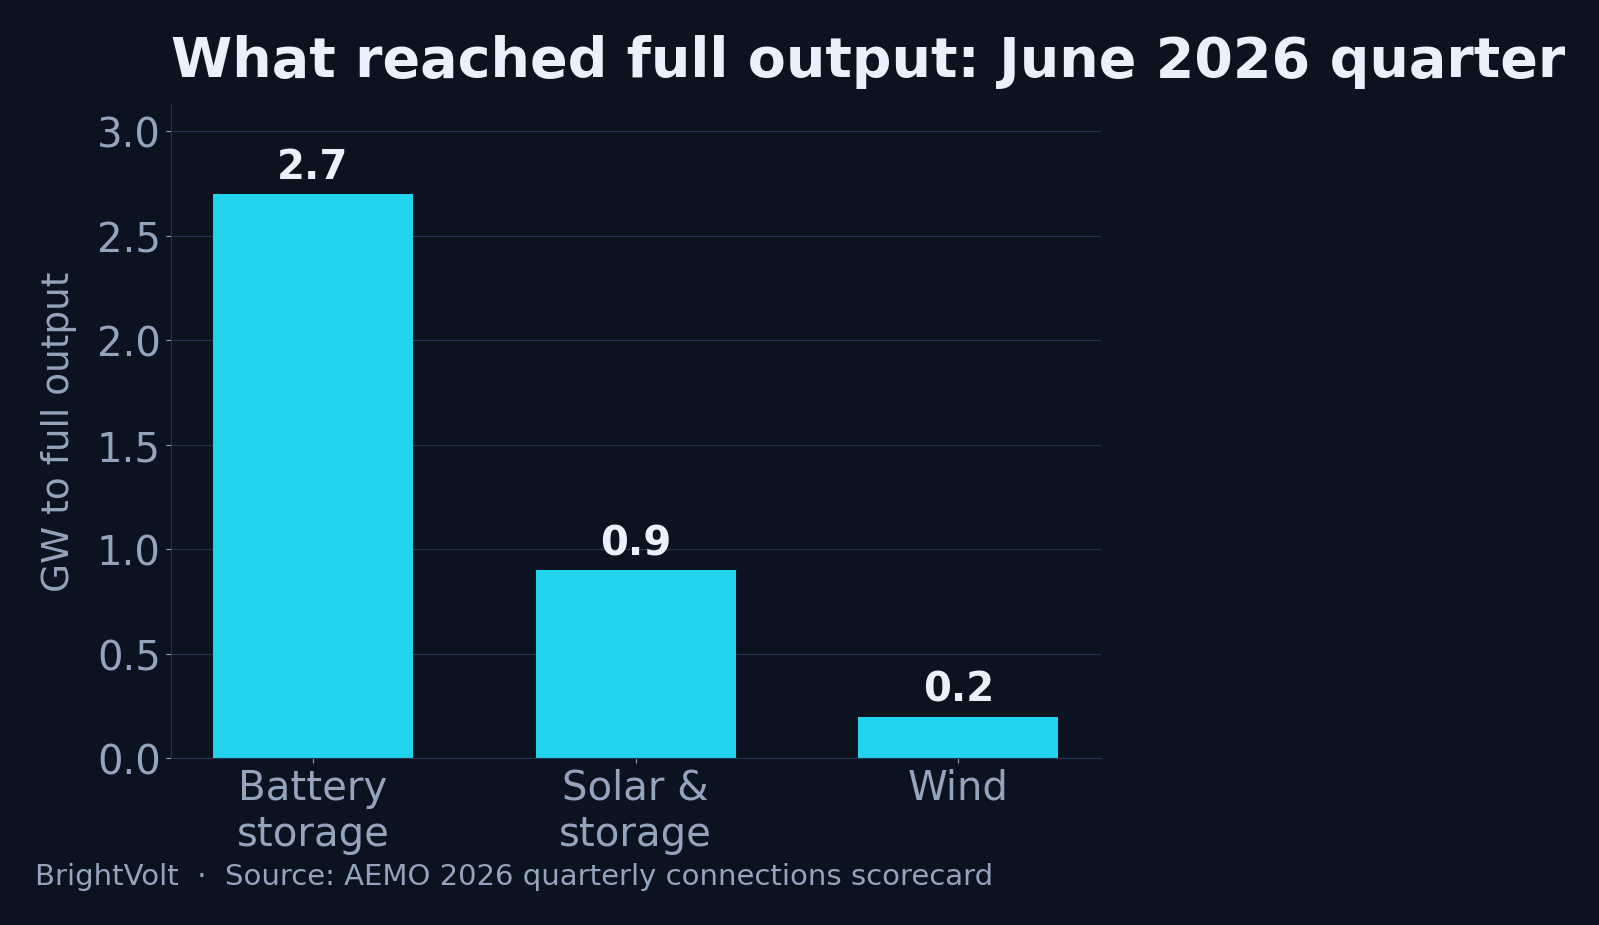
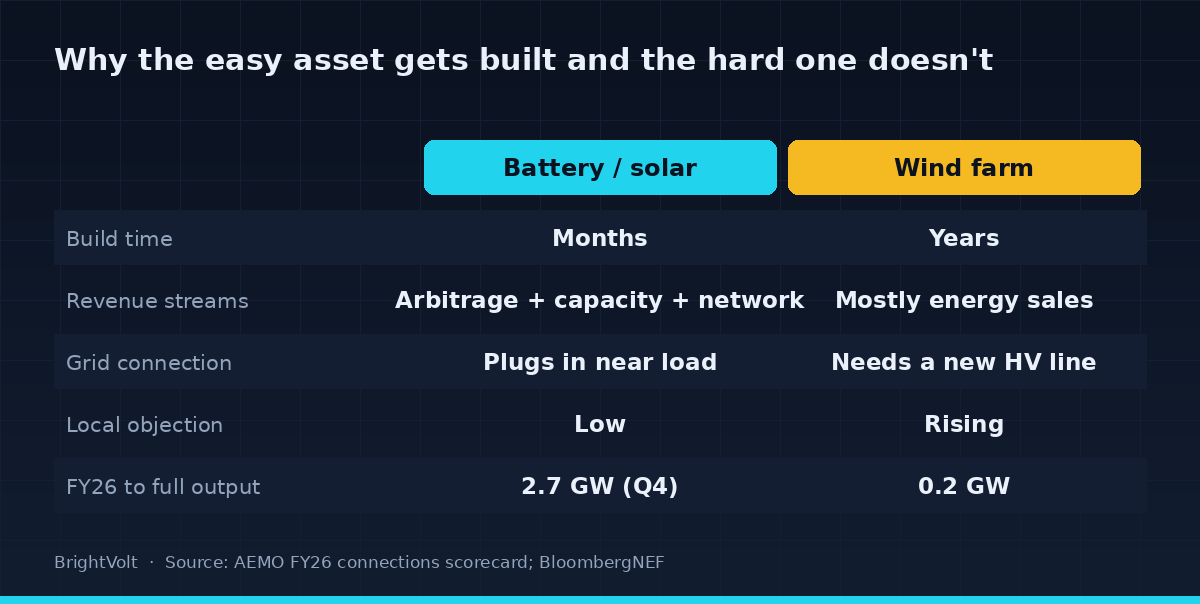
Read past the headline and the composition is the story. Of that 75.4 GW pipeline, batteries are 52% and solar-plus-storage another 18%; wind is 15%. In the June quarter, the split among the 3.9 GW that reached full output was 2.7 GW of batteries, 0.9 GW of solar and solar-plus-storage, and 0.2 GW of wind. The boom is real, and it is almost entirely a battery-and-solar boom.
The money says the same thing. BloombergNEF counted a record A$3 billion of large-scale solar investment in the first half of 2026 — more than triple the A$876 million of the previous half — and 2.9 GW of utility batteries installed, equal to 79% of everything built in all of 2025. Over the same six months, onshore wind commissioned 252 megawatts. A quarter of a gigawatt. In a country of Australia’s wind resource, that is not a rounding error you can wave away as timing.
| Technology | FY26 / H1 2026 result | Direction |
|---|---|---|
| Utility solar | Record A$3bn invested, up from A$876m | Booming |
| Utility batteries | 2.9 GW installed, 79% of all 2025 | Booming |
| Onshore wind | 0.2 GW to full output; 252 MW commissioned | Stalled |
Why 0.2 gigawatts of wind is the number that matters
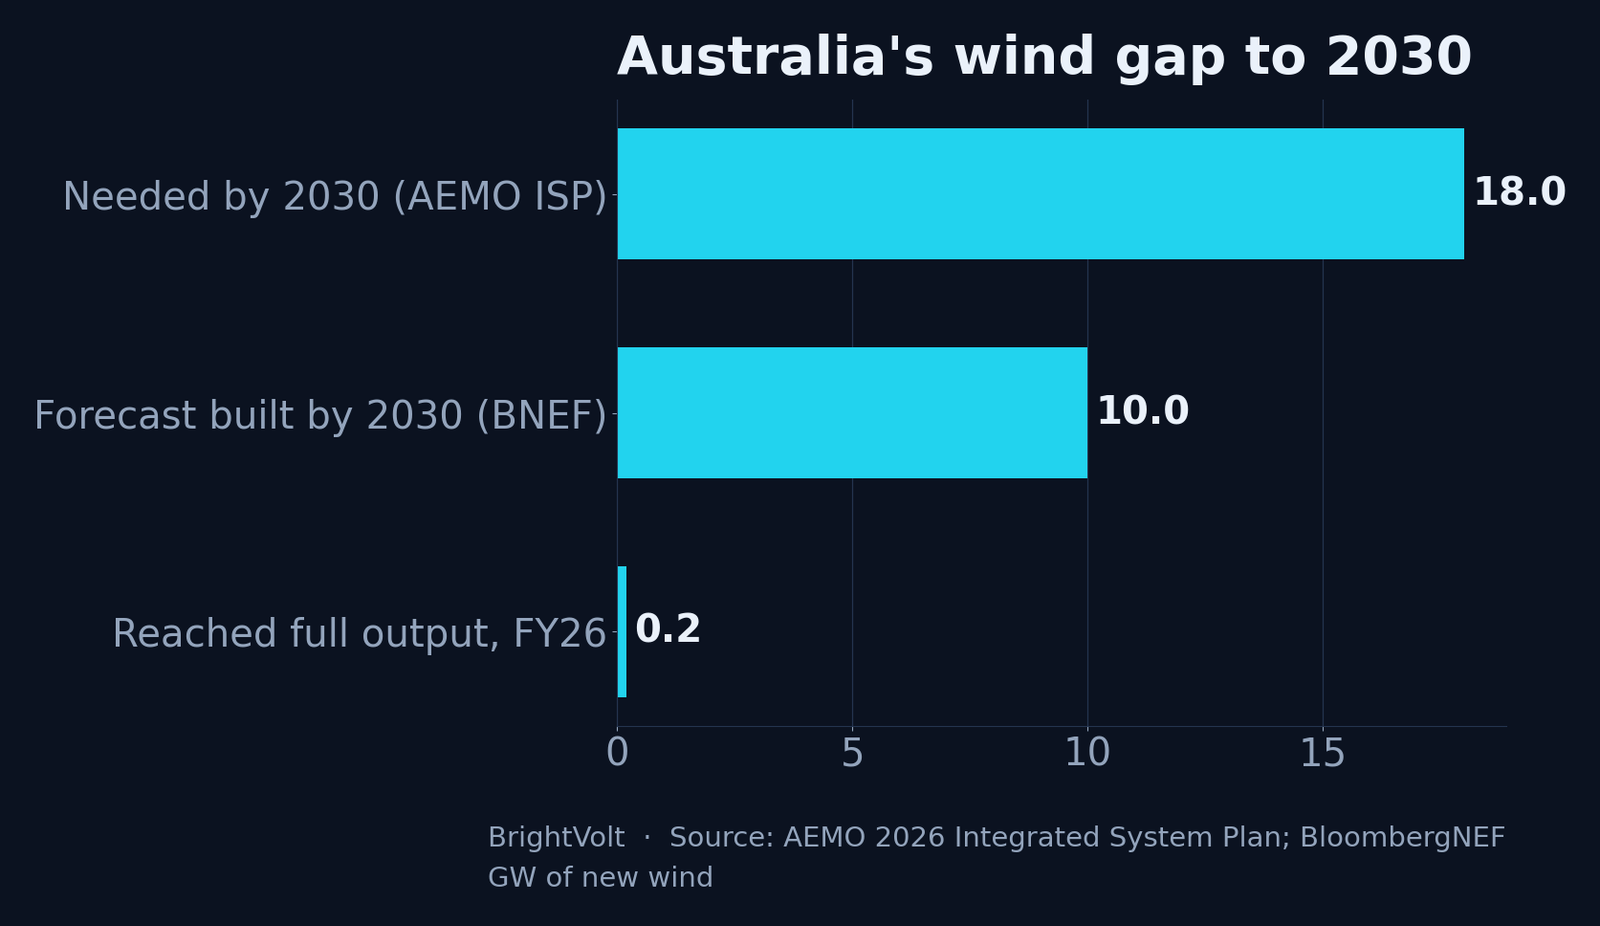
Because the 2030 target was engineered on wind, and the sums do not survive without it. AEMO’s 2026 Integrated System Plan puts the wind Australia needs by 2030 at roughly 18 GW. The pipeline holds about 9 GW — half of it — and BloombergNEF, after cutting its own wind forecast 22% in six months, expects only 10 GW actually built by then. To close the gap, wind construction would have to ramp from around 0.3 GW a year to 2.3 GW a year and hold it. It is currently going the wrong way.
So the target moves. AEMO’s own constrained-delivery scenario now lands at 75% renewables in 2030, seven points short of the 82% written into policy. Private forecasters are darker: BNEF says the target will be missed, and Nexa Advisory’s estimate under current build rates is closer to 60%. None of these are wind sceptics. They are all reading the same connections data and arriving at the same place, which is that the shortfall has one name.
This is the trap in a record year. A doubling headline invites everyone to relax, and the assets doing the doubling are precisely the ones that were never in doubt. Solar panels and battery containers are modular, factory-made, quick to permit and quick to switch on. They were always going to arrive on time. The technology that was in doubt is the one that stayed in doubt — and it is load-bearing.
Batteries move energy. They do not make it.
Here is the substitution error hiding inside the good news: a battery is not a substitute for a wind farm, and a grid cannot store its way out of a generation shortfall. Storage shifts energy in time. It cannot create a kilowatt-hour that was never generated in the first place — the distinction between power and energy that the whole storage conversation keeps dropping. Charge a battery from a solar-heavy grid and you have moved sunshine into the evening. You have not covered the still, overcast week in July when the panels are flat and the load is high. Only generation covers that, and on a decarbonised grid a large slice of it has to be wind, because wind blows at night and in winter when solar does not.
Solar and wind are complements, not rivals for the same slot. Pile on solar without the wind to match it and you get the outcome BrightVolt has written about before: each new panel earns less than the last, midday prices collapse, and the storage you build to rescue the glut still has nothing to shift after dark on the days the sun never really showed up. A grid that is 75% renewable because it ran out of wind is a more expensive, more fragile grid than one that is 82% renewable with the wind in place — not a slightly smaller version of the same thing.
The bottleneck is the wire, not the turbine
Wind is not stalling because the turbines got worse. It is stalling because everything around them got harder at once, and the record year quietly rewards the projects that dodge those problems. A solar-plus-battery site plugs in near load, earns from arbitrage, capacity and network services stacked together — the multiple revenue streams a battery can tap — and dodges the queue. A wind farm sits far from the cities, earns mostly from selling energy, and cannot connect until a new high-voltage line reaches it. Those lines are the choke point: AEMO and BNEF both name grid connection and transmission delivery as the binding constraint, and one key link was recently pushed back two years. Add rising costs, slow permitting and mounting local opposition to turbines, and even the government’s flagship Capacity Investment Scheme is struggling to contract the wind it was built to underwrite.
That asymmetry is why a market left to its own signals overbuilds the easy asset and underbuilds the hard one — even when the hard one is the asset the system actually needs. Records reward whatever is easiest to build. Targets are set by whatever the grid cannot do without. When those two diverge, a record year and a missed target are not a contradiction. They are the same fact told twice.
What would change this read
One thing, cleanly: wind connections actually converting. A record 5.2 GW of wind applications went into the queue in FY26, the highest annual volume Australia has recorded. If even a third of that reaches full output over the next two years — if the FY27 scorecard shows wind jumping from 0.2 GW toward the 2 GW a year the target needs — then the applications were the leading indicator and this read is wrong. The bottleneck would be clearing, not tightening.
The honest case for optimism is that applications lead connections by two to three years, so a wind revival would show up in the pipeline before it shows up in output, and the pipeline is at least growing. Fair. But applications are cheap and connections are dear, the wedge between them is exactly the transmission and permitting wall that is getting higher, and BNEF cut its forecast after seeing the application surge. The queue filling up is not the same as the queue clearing.
So watch three things over the next year: the megawatts of wind that reach full output, not the megawatts that apply; whether the delayed transmission lines energise on their revised dates or slip again; and whether the Capacity Investment Scheme’s next round actually contracts wind at volume. If those move, 82% is back in play. If they don’t, expect the target to be quietly restated as an aspiration, and the record-breaking press releases to keep coming — because the batteries and the panels will keep arriving right on time.
Photo by Ducky on Pexels · Photo by Petr Ganaj on Pexels