

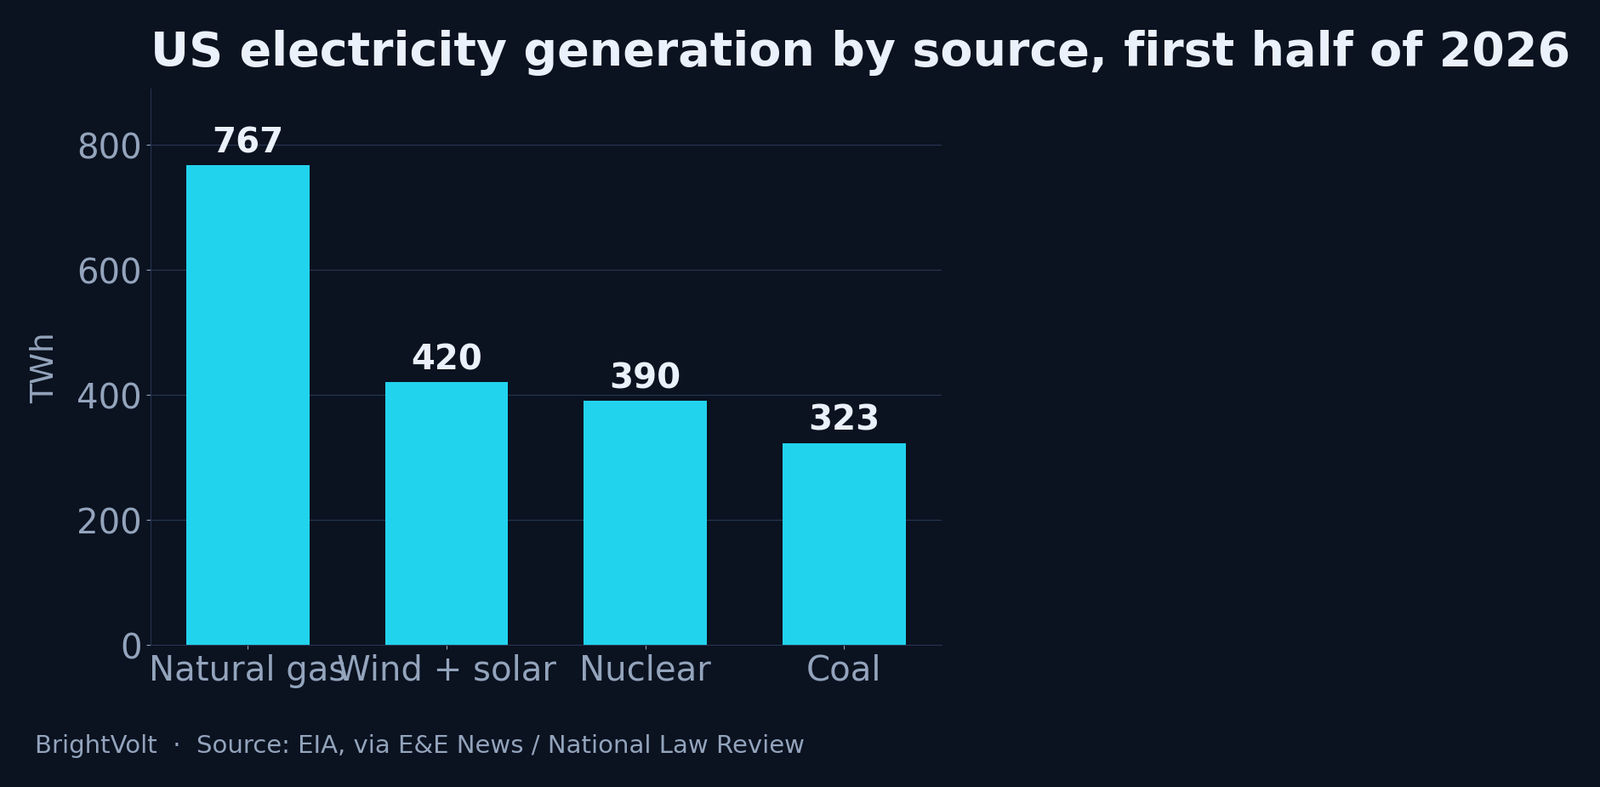
US wind and solar generated roughly 420 terawatt-hours in the first half of 2026 — about a fifth of the country’s electricity, and marginally more than its nuclear fleet’s 390 TWh, on Energy Information Administration figures. Their combined share climbed to 20%, from 18.6% a year earlier. What makes the number worth a second look is the timing. It landed in the same six months Washington set about repealing the credits that paid for the capacity behind it.
Where the 2,079 terawatt-hours came from
Natural gas made the most electricity in the United States in the first half of 2026, and it was not close. The fuel mix for the six months to June ran to 2,079 TWh of total generation, up about 1% on a year earlier, and gas supplied 767 TWh of it — roughly 37%, essentially flat. The interesting part is the order below gas. Wind and solar together made about 420 TWh; nuclear, 390; coal, 323, and coal fell a tenth in a year.
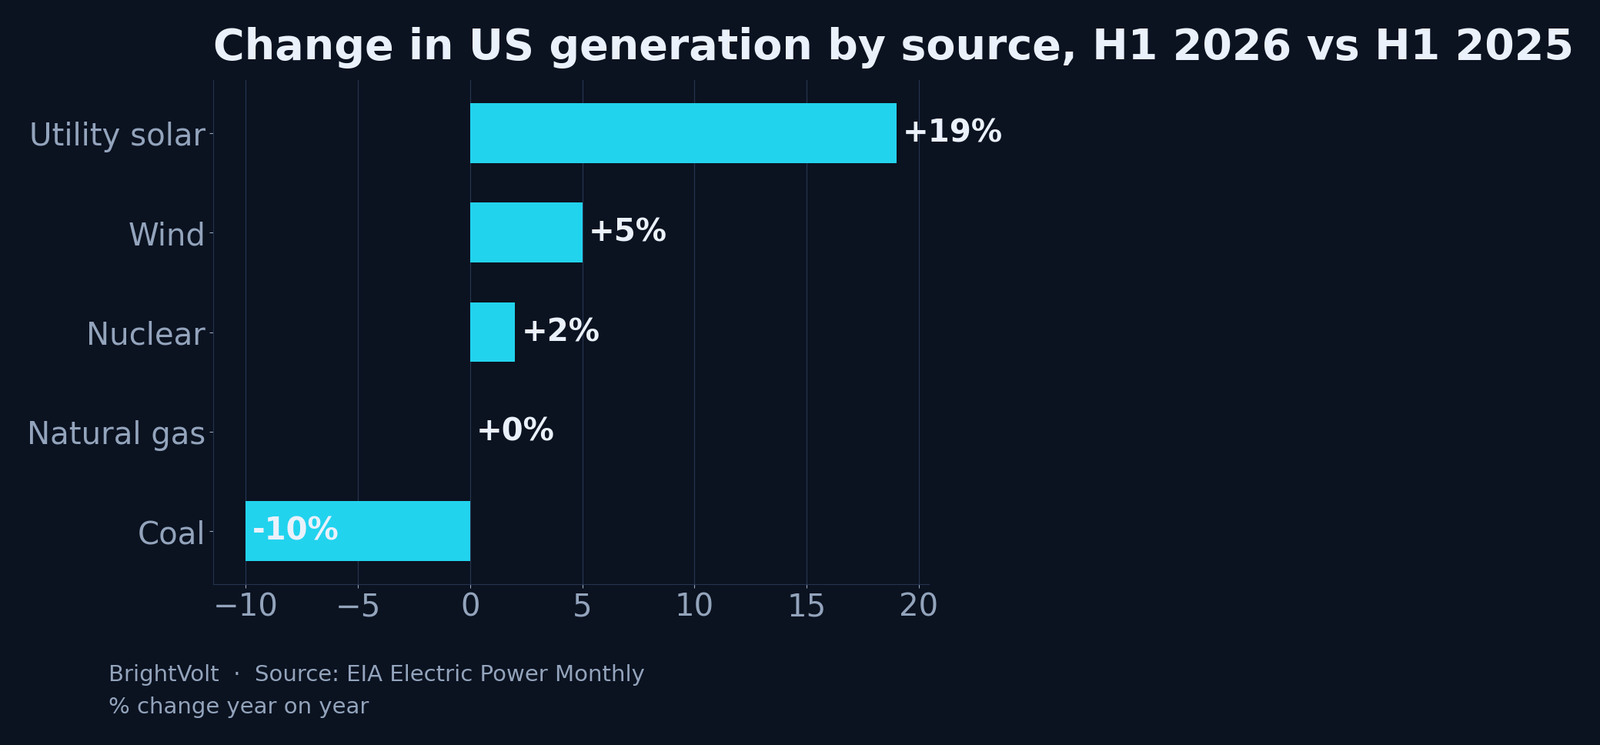
Split the renewable half out and solar is the mover. Utility-scale solar produced 156 TWh, up 19% year on year, while wind added 264 TWh, up around 5%, on the EIA data reported by E&E News. Whether edging above nuclear counts as a historic first depends on whose tally you use — one count had the two crossing as far back as 2024, and over a single quarter it has happened before — so the honest claim is the narrower, more durable one. Wind and solar are now a fifth of US generation and rising, coal is in structural decline, and the gap to nuclear has closed to a rounding error.
| Source | H1 2026 (TWh) | Share | Change vs H1 2025 |
|---|---|---|---|
| Natural gas | 767 | ~37% | flat |
| Wind + solar | 420 | 20% | +10% |
| Nuclear | 390 | ~19% | +2% |
| Coal | 323 | ~16% | −10% |
Solar is doing almost all of the growing
The 10% jump in wind-and-solar output is not evenly shared, and pulling it apart matters. Utility-scale solar carried it, up 19%; wind added only about 5%. Look wider and the pattern holds: across the first four months of the year, renewables as a whole — hydro and the rest included — reached 30% of US generation, up 2.2 points on 2025, and in April wind and solar each, separately, out-produced the entire US coal fleet.
Why solar and not wind is a question of how each gets built. A solar farm is modular, factory-made, quick to permit and quick to energise; a wind project is bespoke, slow to consent, and usually stuck waiting on a transmission line. The capacity pipeline says the same thing the output does. Of the 86 GW of new utility-scale capacity the EIA expects the US grid to add in 2026, solar is 43 GW and batteries another 24 — nearly four-fifths of the total between them — against 12 GW of wind. Generation follows capacity with a lag of a year or two. That lag is the single most useful thing to hold onto here, and the next two sections turn on it.
The number that complicates the victory lap
Here is the figure the celebratory version of this story leaves out: 767. Gas generated 767 TWh in the half against 420 for wind and solar combined — nearly two to one. A 20% share is real and it is climbing, but it is not dominance, and the thing it is climbing against is not shrinking. Gas output was flat to slightly up, not down. Most of the coal that renewables displaced over the past decade did not become wind and solar; it became gas, and gas is holding its ground even now, with a fresh tailwind from data-centre demand that helped push total generation up 1% in an otherwise mild half.
Generation is also not capacity, and the two get conflated constantly. Capacity is what a plant could produce if called; generation is what it actually did. A gigawatt of solar and a gigawatt of gas are not the same gigawatt — the solar runs perhaps a quarter of the hours in a year, the gas plant runs whenever it is dispatched. That single fact is why solar can be four-fifths of new capacity and still only a fifth of generation, and why the capacity-share headlines run so far ahead of the generation-share ones. Both sets of numbers are honest. They are measuring different things, and the distance between them is exactly the gap this year’s headline glosses over.
What the policy reversal changes, and when
Almost none of the first-half numbers reflect current policy, and that is the part most worth understanding. The electricity generated between January and June 2026 came out of wind and solar farms financed and built in 2023, 2024 and 2025, while the tax credits still stood. The repeal of those credits — the July 2026 begin-construction cliff, the tariffs lifting module prices — acts on projects that are not built yet. It will show up in the generation mix in 2027 and 2028, not in this data.
So the “growing anyway” framing that ran alongside these numbers is only half right. Renewables did grow through a hostile year — but on momentum bought earlier, not because the policy failed to bite. The bite is time-delayed by exactly the lag that makes this year’s record look so decisive. And the replacement is not guaranteed to arrive on schedule either: the gas the grid would build instead is stuck behind multi-year turbine and transformer lead times, which is part of why solar and storage keep winning the near-term build by default.

Watch three things over the next eighteen months. Whether 2027 capacity additions fall as the credit-supported pipeline drains. Whether the gas the market wants can actually be delivered against those lead times, or whether renewables hold the field simply because nothing else can be built fast enough. And whether solar-plus-storage keeps pace with data-centre load. If the renewable share keeps climbing into 2027, the transition outran its own subsidies and the credits mattered less than their defenders feared. If it stalls, the credits mattered more than this year’s headline suggests. Either way, the first-half number is a reading to check again in six months — not a finish line to frame.
Photo by Antonio Miralles Andorra on Pexels · Photo by K on Pexels · Photo by Safir Khan on Pexels