

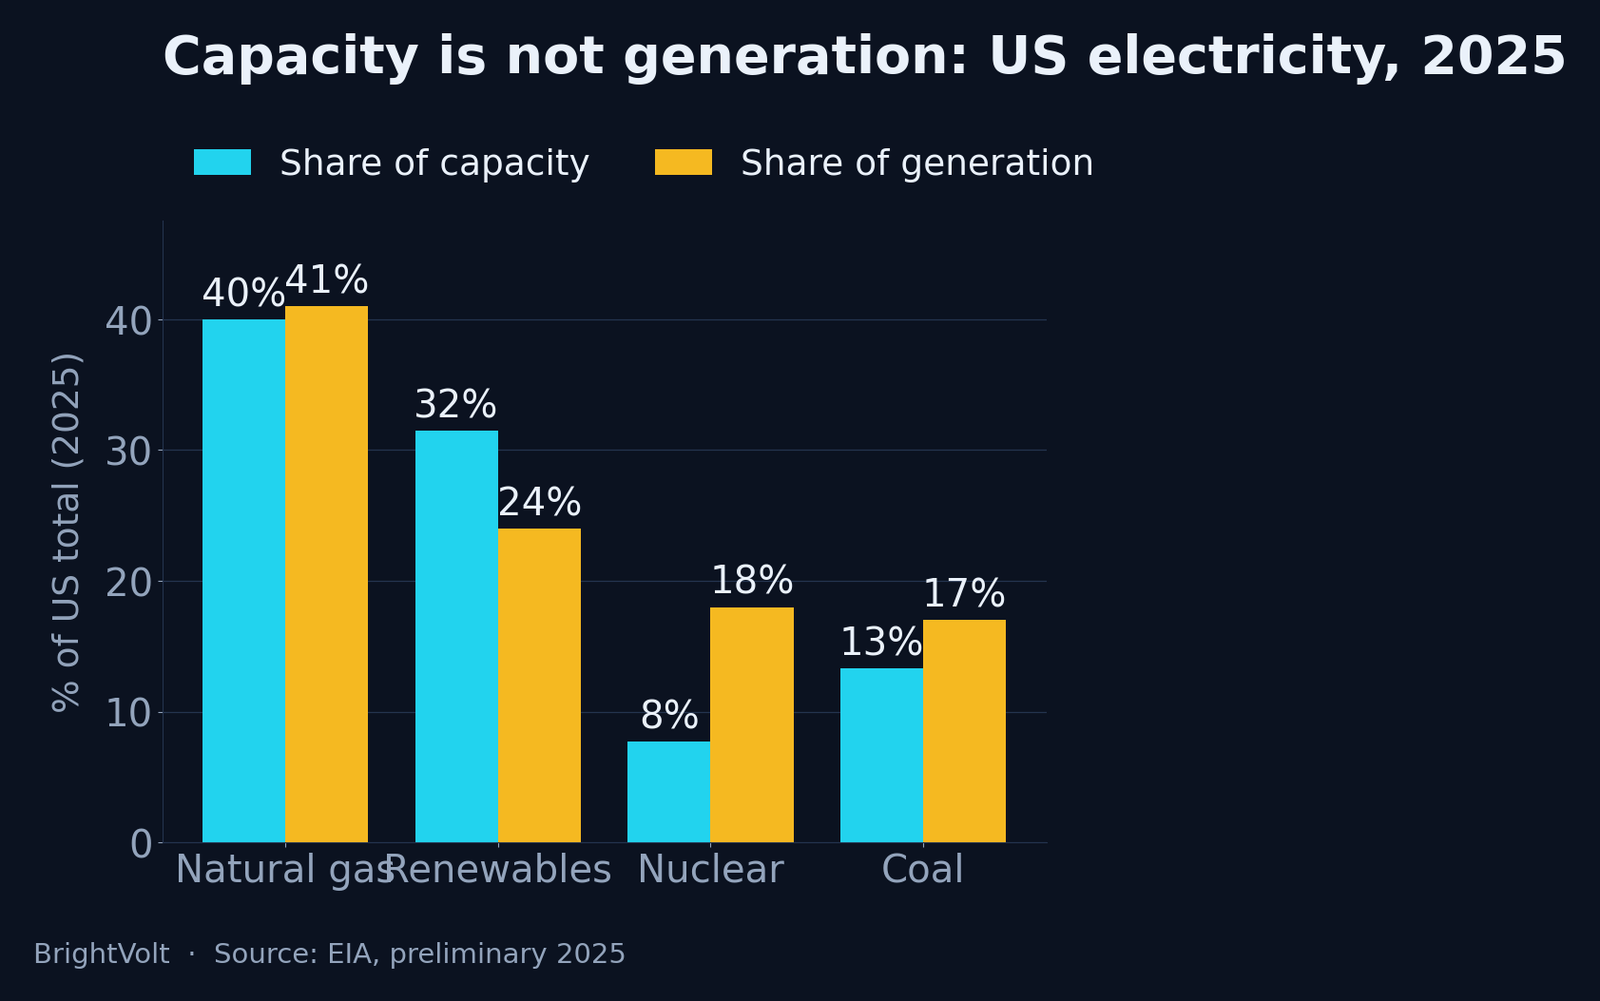
A power plant’s capacity factor is the share of its theoretical maximum output it actually delivers over a year. It is also why the grid’s headline numbers mislead. In 2025, US nuclear plants supplied about 18% of the country’s electricity from just 7.7% of installed capacity, while renewables held 31.5% of capacity and produced 24% of the power.
Nameplate capacity — the megawatts stamped on a plant — tells you how fast it can generate. Capacity factor tells you how often it does. The two get quoted interchangeably, and the confusion always runs the same way: a gigawatt of solar and a gigawatt of nuclear are treated as the same gigawatt. They are nothing alike.
What capacity factor actually measures
Capacity factor is a ratio. Take what a plant produced over a year, divide it by what it would have made running flat out for every hour, and the result is a percentage. A 1 GW plant running at full output for all 8,760 hours of a year would generate 8.76 terawatt-hours. If it actually generated 4.38 TWh, its capacity factor is 50%.
Nothing in that number grades the machine. A solar farm at 23% is not worse engineering than a gas plant at 59% — the sun sets, and no panel was ever designed to run at midnight. Capacity factor folds together two very different things: whether a plant can run, which is its availability, and whether it is asked to run, which is how the grid dispatches it. A nuclear reactor scores high on both. A peaker scores low on the second on purpose.
That distinction matters because it explains why the same technology posts different numbers in different places. A combined-cycle gas plant in Texas runs harder than an identical one in a hydro-rich region, not because the turbines differ but because the grid calls on it more often. Capacity factor is as much a statement about the system around the plant as about the plant itself.
Why 1 GW of solar isn’t 1 GW of gas
Run the arithmetic across technologies and the spread is stark. Each row below starts from the same one gigawatt of nameplate capacity and applies that technology’s US capacity factor to a full year.
| Technology | Capacity factor | Electricity from 1 GW in a year |
|---|---|---|
| Nuclear | ~92% | 8.1 TWh |
| Gas combined-cycle | ~59% | 5.2 TWh |
| Geothermal | ~65% | 5.7 TWh |
| Wind (onshore) | ~34% | 3.0 TWh |
| Solar PV | ~23% | 2.0 TWh |
| Gas peaker | ~13% | 1.1 TWh |
To match the annual output of a single gigawatt of nuclear, you would need roughly four gigawatts of solar panels. And that is only the volume. The nuclear gigawatt arrives as a flat line you can schedule around at three in the morning; the solar four gigawatts arrive in a heap at midday and vanish at dusk. Capacity factor captures the first gap. It says nothing about the second.

This is the number behind every honest comparison of build-out plans. When a country announces it has installed more solar capacity than its entire nuclear fleet, the capacity factor is what stands between that headline and the electricity actually produced. Ignore it and 30 GW of new solar reads like 30 GW of new nuclear. Apply it and the solar does about a quarter of the work.
Baseload, mid-merit and peaker: the number that sorts them
The grid’s whole vocabulary of plant types is really a vocabulary of capacity factors. The EIA sorts generators into three duty classes by exactly this metric: base-load plants run at 70% or higher, peaking plants run at less than 15%, and everything in between is intermediate.
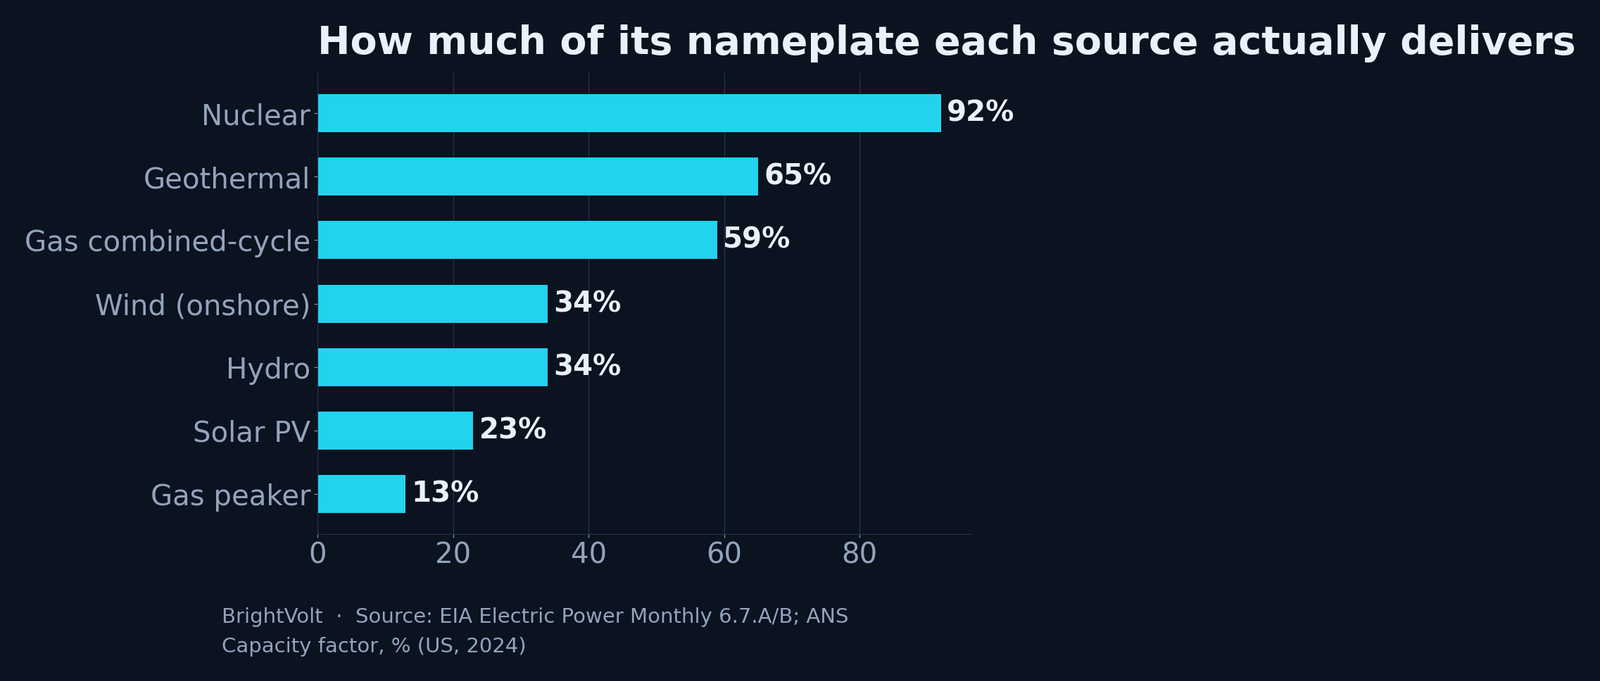
Nuclear anchors the top. The US fleet has held a median capacity factor near 91% across 2022–2024, the reward for a machine that is expensive to build and nearly free to keep running, so operators run it whenever it is not being refuelled. Combined-cycle gas sits in the mid-merit band at just under 60%, dispatched hard but backed off when cheaper power is available. Coal, once the definition of baseload, now cycles with the seasons — above 60% in the winter and summer peaks, below 50% in spring and autumn when gas and renewables undercut it.
At the bottom sit the peakers. A simple-cycle gas turbine averages around 13%, and in most regions far less. A peaker spends the overwhelming majority of the year switched off, waiting. That is not a failing grade. It is the job description — the plant exists to cover the few dozen hours a year when demand outruns everything cheaper, and its low capacity factor is the whole reason its electricity is the most expensive on the system.
Wind and solar land in between, at roughly 34% and 23% respectively, but for a reason unlike any of the above. Their ceiling is not economics or maintenance. It is weather. A wind farm cannot be dispatched harder when the grid wants more; it produces what the wind allows and no more, which is why capacity factor for renewables is less a decision than a climate reading.
What capacity factor doesn’t tell you
For a single number that explains so much, capacity factor is quietly misused, because people ask it questions it does not answer.
It does not measure value. A plant with a high capacity factor that generates when power is worthless earns less than the figure implies. Solar’s problem is not only that its capacity factor is 23% but that much of that 23% arrives at the same midday moment as everyone else’s, which is why each new solar farm earns less than the last. Capacity factor tells you how much; it says nothing about what that output is worth when it shows up.
It does not measure reliability contribution. For keeping the lights on, what counts is output during the few tightest hours of the year, not the annual average. A solar farm’s 23% badly overstates what it can be relied on to deliver at 7pm in a heatwave — the metric that captures that is effective load-carrying capability, and it is usually a fraction of the capacity factor.
And it does not settle cost. A solar farm running at 23% can still be the cheapest electricity on the grid, because the denominator in a cost-per-megawatt-hour calculation is lifetime output, but the fuel bill is zero. Low capacity factor raises the per-unit cost of the hardware; free sunlight can win anyway. The number is an input to that argument, not the verdict.
What to watch is the way storage is starting to blur the whole framework. Pair a solar farm with a battery and the combination’s effective capacity factor — measured as useful, dispatchable output — climbs well above the panel’s 23%, while the peaker it displaces sinks further toward zero. The duration of that storage is what decides how far. Capacity factor is the multiplier that turns a spec sheet into electricity. It settles none of the arguments about cost, value or reliability on its own — but every one of those arguments goes wrong if it starts from nameplate megawatts and forgets to apply it.
Photo by K on Pexels · Photo by Giant Asparagus on Pexels