

The levelized cost of energy, or LCOE, is a single number: a power plant’s total lifetime cost divided by the total electricity it produces over its life, usually quoted in dollars per megawatt-hour. It is the most-cited figure in energy — and the most misused. In 2026, new US solar came in at $40 to $98 per MWh. That number answers one question well and three others not at all.
LCOE is what people reach for when they say solar is “the cheapest electricity in history” or that a nuclear plant is “too expensive to build.” Both claims lean on the same arithmetic, and the arithmetic is sound as far as it goes. The trouble starts when a number built to compare the lifetime cost of building new plants is used to decide what electricity is worth, what a grid should run on, or whether to keep an existing plant open. It cannot settle any of those. Here is what it does measure, and where it quietly misleads.

What LCOE actually measures
LCOE adds up everything a plant costs over its life — the capital to build it, the fuel to run it, maintenance, and the financing on the money borrowed to build it — and divides that total by every megawatt-hour it is expected to generate before it retires. Discount the future costs and future output back to today’s money, and the result is a break-even price: the average revenue per MWh the plant would need, across its whole life, to cover itself.
That makes it genuinely useful for one comparison. Two ways of building the same kind of new generation, side by side, can be ranked by LCOE and the lower one is cheaper to build and run per unit of output. The investment bank Lazard has published an annual LCOE analysis since 2008 that has become the industry’s reference, and its 2026 edition tells a clear story about new-build costs.
| Technology (new build, 2026) | Unsubsidized LCOE ($/MWh) |
|---|---|
| Onshore wind | 37–99 |
| Utility-scale solar | 40–98 |
| Gas combined-cycle | 51–129 |
| Solar + storage | 61–156 |
| Offshore wind | 105–167 |
| Nuclear | 175–255 |
| Standalone storage (4-hour) | 210–292 |
Read down that column and the case for wind and solar looks settled. It mostly is, on the narrow question the column answers. It is the questions the column does not answer that cause the damage.
Why the denominator does most of the work
The number most people stare at is the cost on top. The number that actually swings LCOE is the output on the bottom.
A plant’s lifetime output is its capacity multiplied by its capacity factor — the share of its theoretical maximum it actually produces — across all the hours of its life. Change that fraction and the whole ratio moves. A solar farm running at a 23% capacity factor spreads its cost over far fewer megawatt-hours than a gas plant running at 60%, which is why identical build costs can produce very different LCOEs.
Push that to the extreme and it explains one of the field’s most misread numbers. A gas peaker that runs a few hundred hours a year has a tiny denominator, so its LCOE looks astronomical — often the highest of any technology. That does not mean peakers are a mistake. It means LCOE is the wrong lens for a plant whose job is to exist, not to run. The number is measuring average cost per unit for a machine that was never meant to produce many units.
The denominator is also why cost of capital matters so much for wind and solar. Their costs are almost all upfront and borrowed, so the interest rate on that capital is a large share of the final figure. That is precisely why 2026 solar rose — Lazard put utility solar up 18% year on year, driven by higher capital costs, interest rates and tariffs, even as the technology remains roughly 81% cheaper than in its first edition. Nothing about the panels got worse. The money did.
What LCOE leaves out
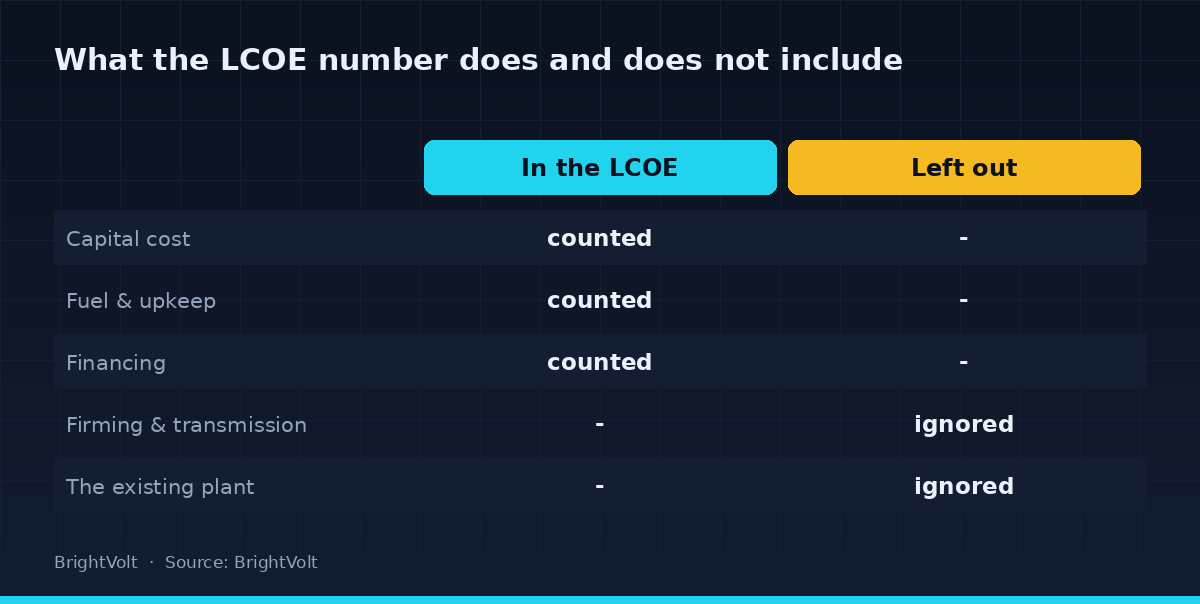
The larger problem is what never enters the calculation at all.
LCOE prices a plant’s own output in isolation. It does not price what it costs to turn that output into reliable power on demand — the batteries, the gas backup, the transmission and the curtailment that firming a variable resource requires. A solar farm’s LCOE is the cost of the solar farm, not the cost of solar electricity available at 8 pm. Lazard now publishes a separate “LCOE with firming” and an “Always On” figure precisely because the headline number excludes the costs needed to keep the grid stable. Those costs are real, they rise as a grid leans harder on variable generation, and they land on someone.
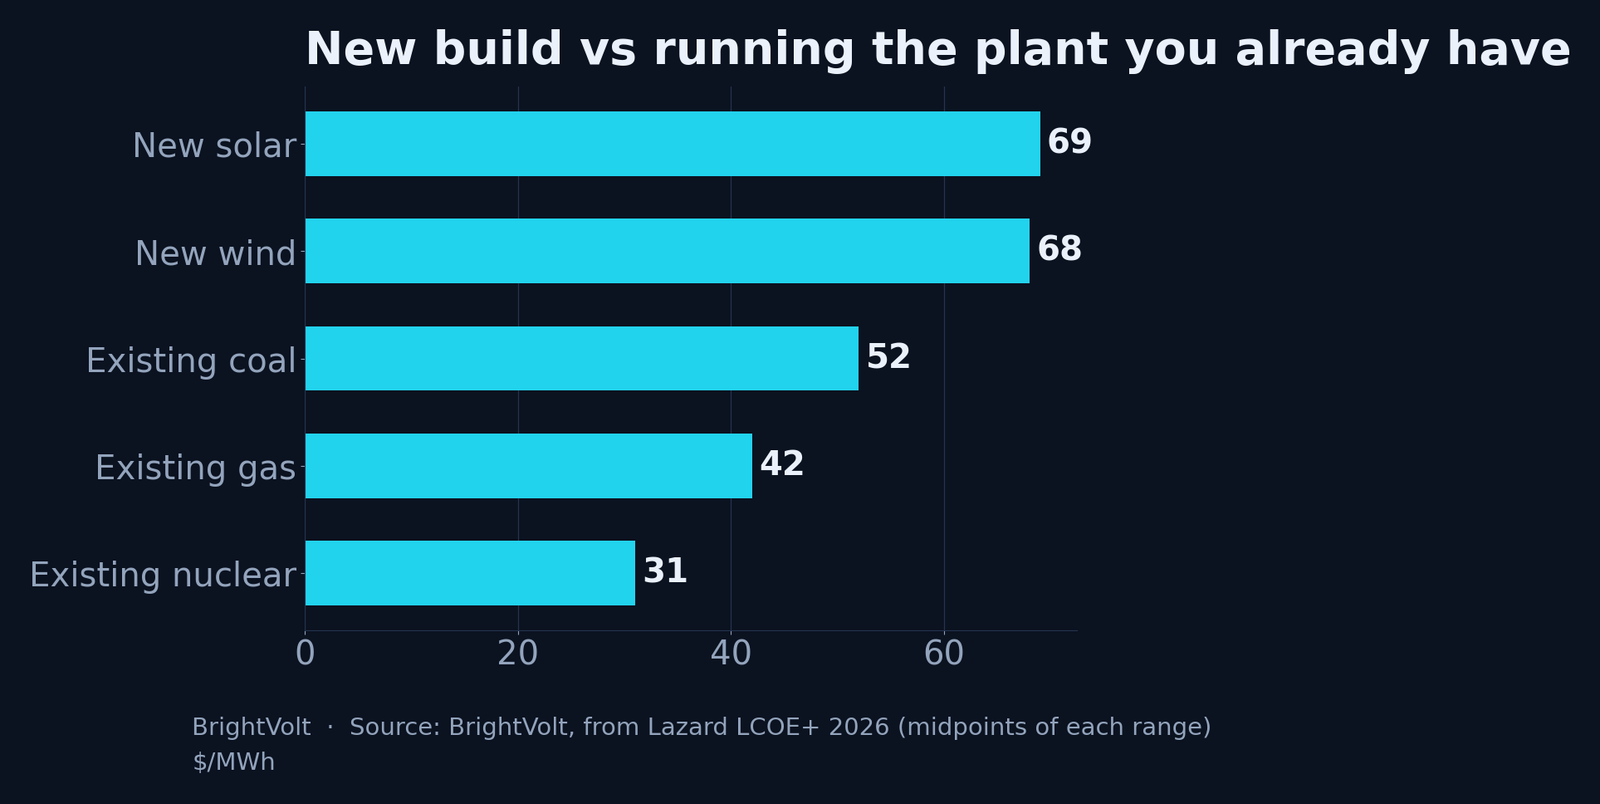
That blind spot became the headline of the 2026 report. LCOE compares the cost of building new generation. It says nothing about the cost of running a plant that already exists — whose construction was paid off long ago, and whose only remaining cost is fuel and upkeep. Lazard’s own figures put the marginal cost of an existing nuclear plant at $26–36/MWh, an existing gas combined-cycle plant at $32–51, and existing coal at $34–69. New wind and solar, at $37 and up, do not automatically beat those. For a grid deciding whether to retire a working plant, LCOE is not just unhelpful — it points the wrong way.
How to read an LCOE number without being fooled
Treat LCOE as the answer to exactly one question: what does it cost, on average over its life, to build and run this new plant and use its own output? Whenever someone stretches it further, check which of three things they are quietly assuming.
They may be using it to decide what to build — but that needs the firming and system costs LCOE omits. They may be using it as the value of the electricity — but value depends on when the power arrives, which is the capture-rate problem, not the cost problem. Or they may be comparing a new plant to the grid as if the grid were empty — when the real alternative is often an existing plant running at a third of the new one’s cost.
None of this makes LCOE a bad number. It makes it a specific one. The falling line everyone quotes was always the cost of new solar’s own output, never the cost of a reliable grid built around it. The two diverge exactly where the decisions get hard — at firming, at timing, and at the paid-off plant nobody counts. Watch whether Lazard’s firmed and “always on” figures start displacing the headline number in policy debates. Until they do, the most-quoted figure in energy will keep answering a narrower question than the people quoting it think.
Photo by Kindel Media on Pexels · Photo by Peechie247 on Pexels · Photo by Tanhauser Vázquez R. on Pexels