
Load factor is your average electricity demand divided by your peak demand over a period — a number between zero and one. A 24/7 data centre runs about 0.88; a restaurant about 0.32. It is the single figure that predicts how much of an electricity bill is demand charges rather than energy, and how much a battery could do about it. Almost nobody outside a utility planning department ever sees it, which is a shame, because it explains more of a commercial bill than the price per kilowatt-hour does.
What the number actually measures
The EIA defines load factor as “the ratio of the average load to peak load during a specified time interval.” In the form a business can calculate from its own bill, that is total kWh divided by peak kW times the hours in the period:
Load factor = total kWh ÷ (peak kW × hours)
A site that draws 36,000 kWh in a 30-day month with a 100 kW peak has a load factor of 36,000 ÷ (100 × 720) = 0.50. It used half the energy it would have used had it run flat out at its peak the whole month. Run perfectly flat, around the clock, and the number approaches 1. Run in short, sharp bursts with long quiet stretches, and it falls toward 0. Most commercial buildings sit between 0.30 and 0.70; at the neighbourhood transformer the figure typically lands between 0.4 and 0.6.
That is the whole definition. What makes it worth knowing is that it is not just a description of a load shape — it is a price.
Why a low load factor costs money
An energy charge bills what you used. A demand charge bills the single highest fifteen-minute peak you hit, whether you held it for a month or a minute. Load factor is the ratio between those two quantities, which makes it the exact thing a demand charge monetises: the wider the gap between your average draw and your worst quarter-hour, the larger the share of your bill that peak represents.
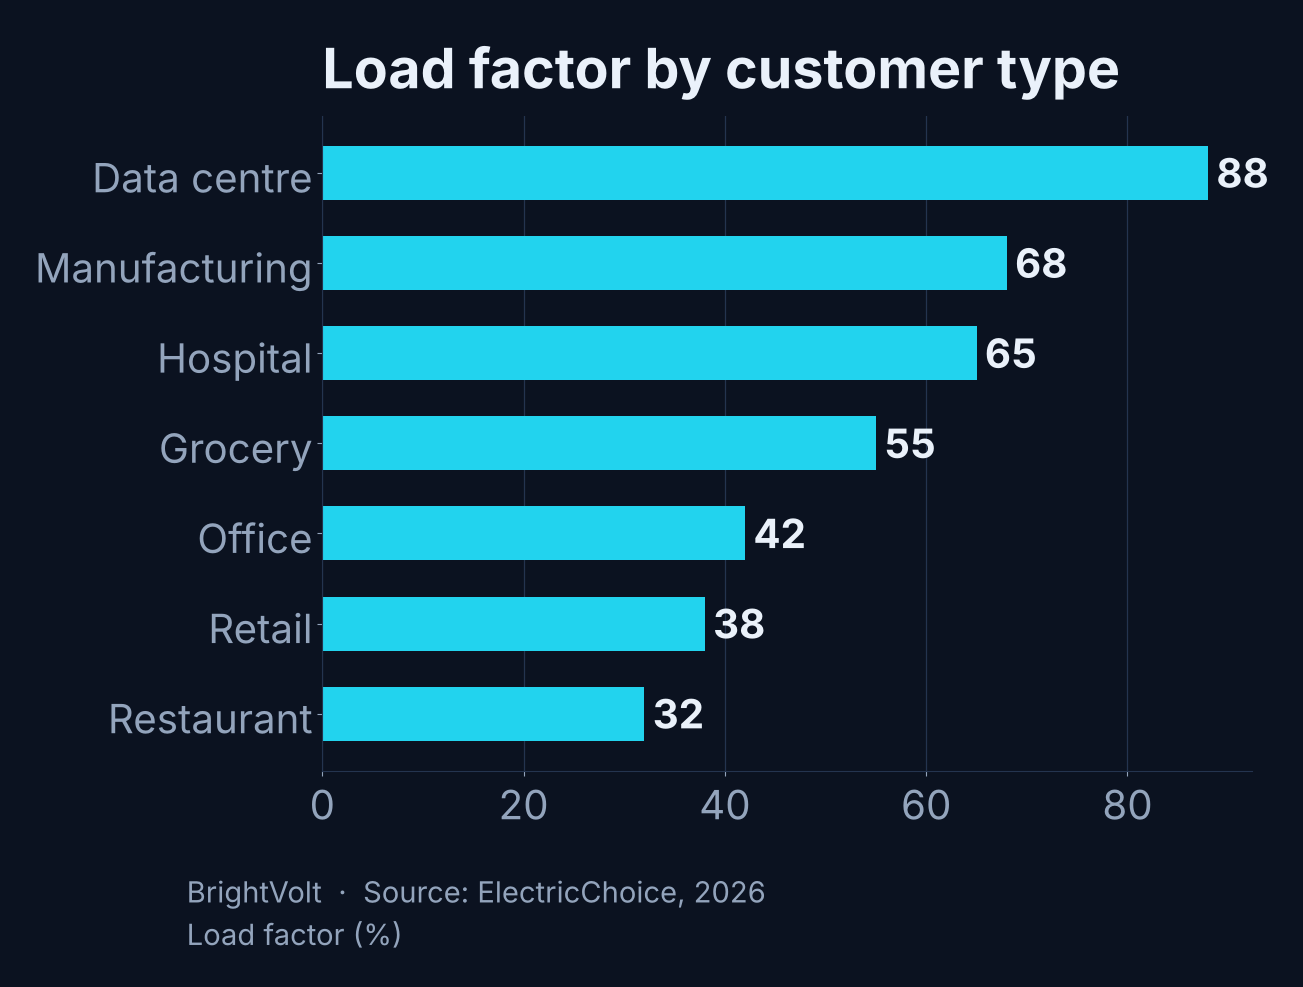
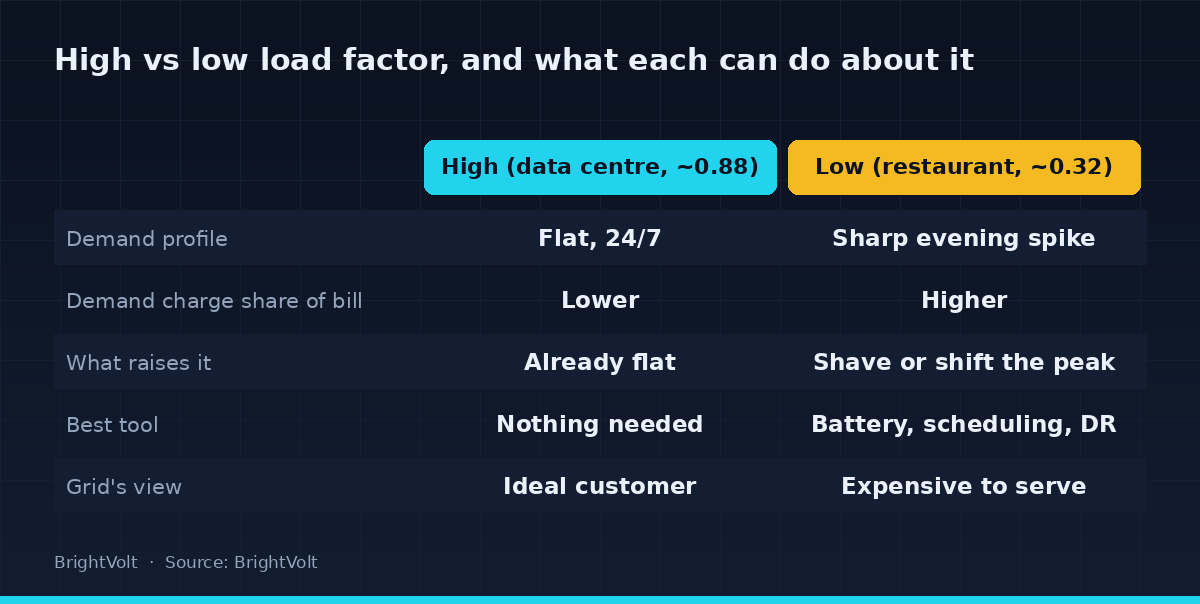
The spread across customer types is wide and it is not random. A data centre near 0.88 draws almost the same power at 4am as at 4pm, so its demand charge is spread over a load that barely moves. A restaurant near 0.32 pays a demand charge sized to a dinner-service peak it hits for perhaps an hour a day, carried by a bill that is otherwise small. Trade guidance grades anything above 70% as excellent and anything below 25% as critical, with demand charges running from a third to more than half of the total bill as the load factor falls.
The practical consequence is counter-intuitive. You cut a demand charge by shaving the peak, not by using fewer kilowatt-hours — a building can halve its demand charge without changing its annual consumption at all. That is why a battery bought to beat demand charges is sized first in kilowatts, how hard it can discharge against the peak, and only second in kilowatt-hours. It is also why the same behind-the-meter battery that is marginal for a flat warehouse pays for itself at a spiky one. Load factor tells you which building is which before anyone quotes a system.
Load factor versus capacity factor
The two get confused constantly, because they are the same arithmetic run on opposite sides of the meter. Capacity factor measures a generator: its actual output divided by the maximum it could have produced. Load factor measures demand: average draw divided by peak draw. One asks how fully a power plant is used; the other asks how evenly a consumer draws.
| Load factor | Capacity factor | |
|---|---|---|
| Side of the meter | Demand | Supply |
| Formula | avg demand ÷ peak demand | actual output ÷ nameplate |
| Low because | the load is spiky | the plant sits idle |
| Typical | restaurant ~0.32, data centre ~0.88 | solar ~0.23, nuclear ~0.92 |
Neither is a grade. A solar farm’s low capacity factor is the sun setting, not a fault; a restaurant’s low load factor is its opening hours, not waste. Both numbers describe a pattern of use, and both cost money in the same way — unused capacity someone still had to build and pay for.
The whole grid runs on the same ratio
Scale load factor up from one meter to a country and it becomes the central fact of power-system economics. The United States generated a record roughly 4,430 TWh in 2025 — an average of about 506 GW spread across the year — against a peak demand of 759 GW on 29 July. That is a system load factor near 0.67. Two-thirds. The remaining third is capacity built for hours that rarely arrive: the peaker plants and reserves that sit idle most of the year and set the market price on the few afternoons they run.

Which is where the load everyone is now worried about turns the usual story inside out. Data centres have the highest load factor of any customer class, because they run flat, day and night. To a utility that makes them close to an ideal customer: a load near 0.9 uses the wires and plants it is already paying for almost continuously, rather than forcing new capacity to be built for a peak. The strain AI puts on the grid is not a spiky peak. It is a higher, flatter floor — more energy, not more peakiness. The customers actually dragging the system load factor down are the old ones: the air-conditioned July afternoon, and the row of EVs that all start charging at six.
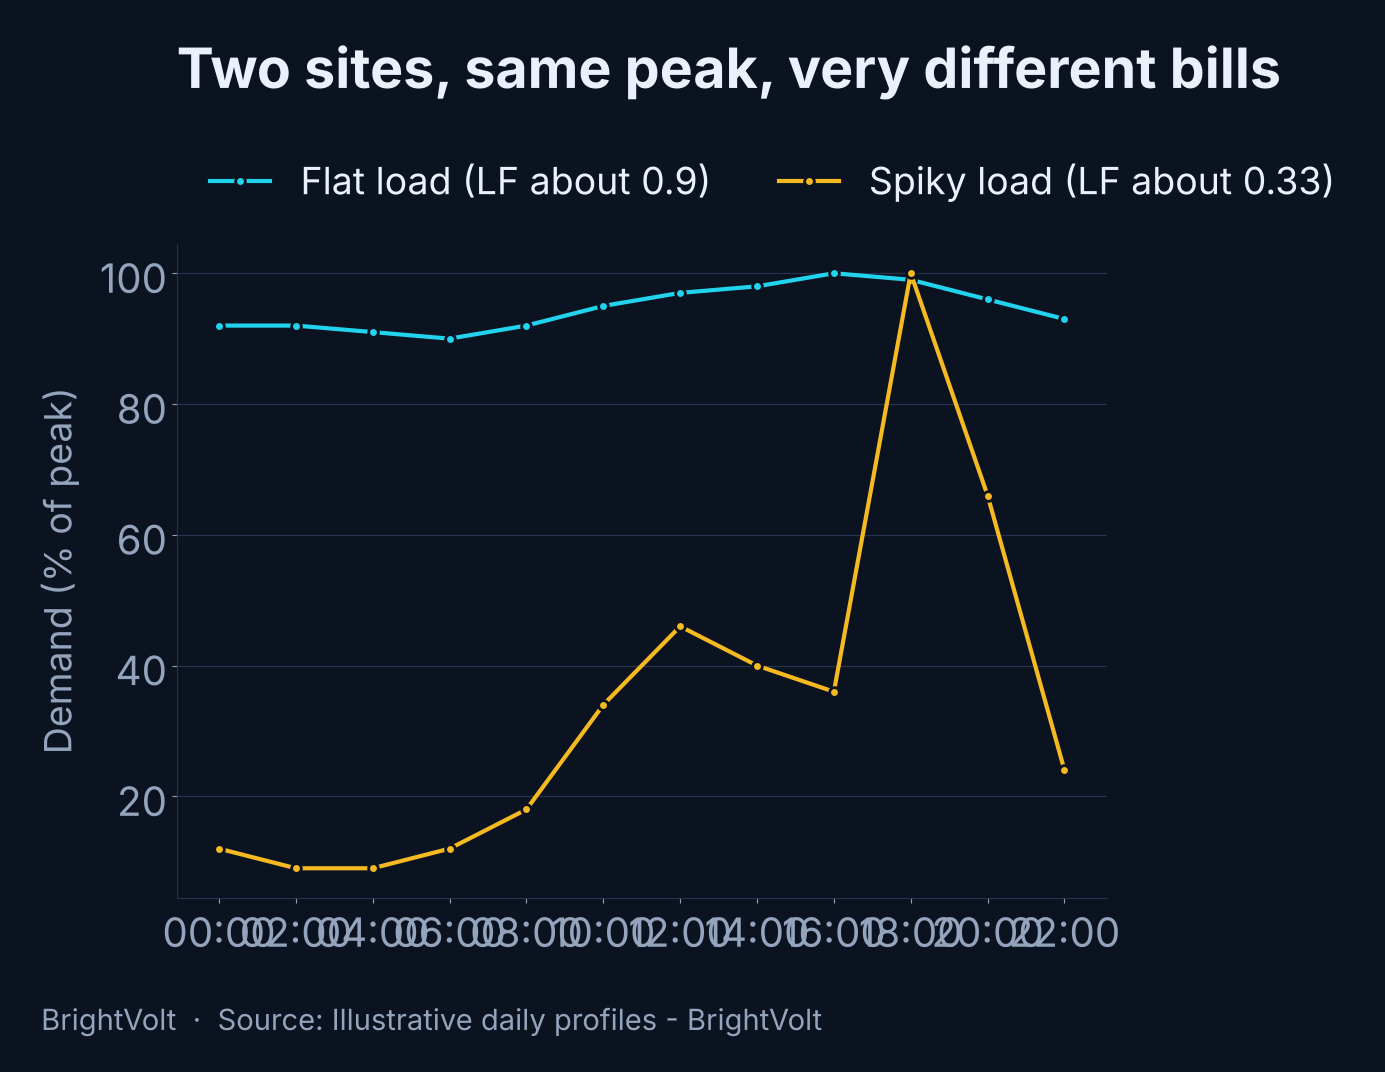
So the cheapest capacity on the grid is often the peak nobody has to build. Every tool that flattens demand — a battery, an EV told to charge at 2am instead of 6pm, a demand-response signal, a time-of-use tariff — raises load factor and wrings more work out of assets that are already paid for. The number worth watching, on a bill or across a grid, is not total consumption. It is the gap between the average and the worst fifteen minutes, because that gap is what everyone is paying to keep in reserve.
Photo by Diana ✨ on Pexels · Photo by panumas nikhomkhai on Pexels