
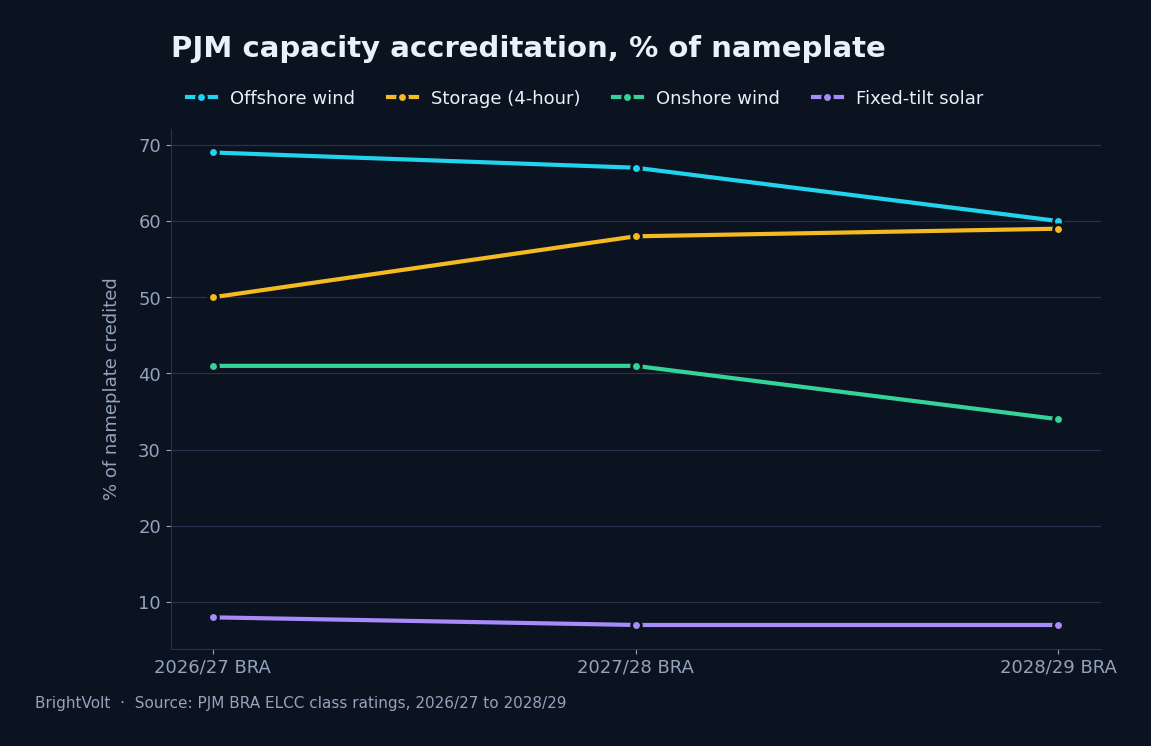
In PJM’s 2026/27 capacity auction, onshore wind was credited at 41% of its nameplate rating and a four-hour battery at 50%. In the 2028/29 auction held this July, wind was credited at 34% and the battery at 59%. Storage has overtaken wind on the one measure wind was supposed to win — the probability of showing up when the grid is closest to failing.
That crossing happened in two auction cycles, and it is the most important thing to have happened to wind economics this decade.
What accreditation is, and why wind used to win it
Grid operators do not buy megawatts. They buy the probability that a megawatt is generating during the hours the system is short, and effective load carrying capability — ELCC — is the fraction of a resource’s nameplate rating that counts toward that requirement. It is the least glamorous number in the electricity business and it decides who gets paid.
Wind’s historical advantage was seasonal. PJM’s class ratings for 2026/27 put offshore wind at 69% and onshore at 41% against 8% for fixed-tilt solar, because the grid’s moment of maximum danger has moved to winter. PJM’s winter share of expected loss-of-load hours rose to 82.4% in 2026/27 from 65.0% the year before. The risk is now a January morning before sunrise, with data centre load that does not care what season it is.
MISO states the consequence in one line. In its 2025-26 planning year, solar was credited at 50% in summer, autumn and spring — and 5% in winter. Wind was credited at 29% in winter, its second-best season.
None of that has changed. What changed is who else can do it.
Why the crossover happened
Two things at once, and only one of them is about wind.
The first is saturation, and PJM has been forecasting it for years. As wind penetration rises, the binding risk stops being ordinary winter nights — which wind covers — and becomes days of correlated fleet-wide stillness, which it cannot. PJM’s modelling has the still-air pattern of 8 January 2014 growing from 7.0% of expected loss-of-load hours in delivery year 2027 to 25.2% by 2035. Wind cannibalises its own capacity value. Build enough of it and the fifth megawatt is worth a fraction of the first.
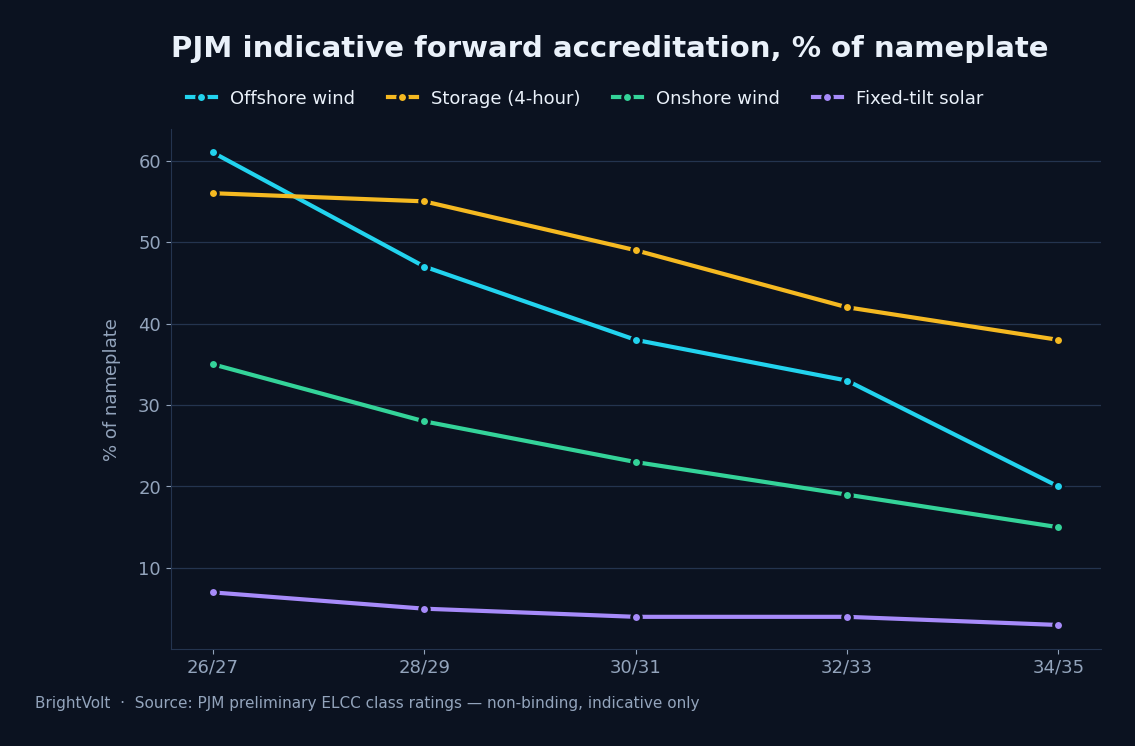
PJM’s own indicative projections, produced under a methodology FERC approved in January 2024, have onshore wind falling to 15% and offshore to 20% by the middle of the next decade. PJM labels these non-binding and warns they will differ from auction results, which is fair — but the 2028/29 print came in at 34% against an indicative 28%, so the direction is being confirmed even where the level is not.
The second is that batteries stopped being a niche. Four-hour storage went from 50% to 59% across the same three auctions while its cost fell: BloombergNEF’s December 2025 survey put lithium-ion pack prices down 8% on the year to a record-low $108/kWh, after a 20% fall in 2024. A resource whose accreditation is rising and whose cost is falling does not need to be better than wind at anything in particular. It only needs to be cheaper per unit of accredited capacity, and it now is.
The cost side, where wind is losing badly
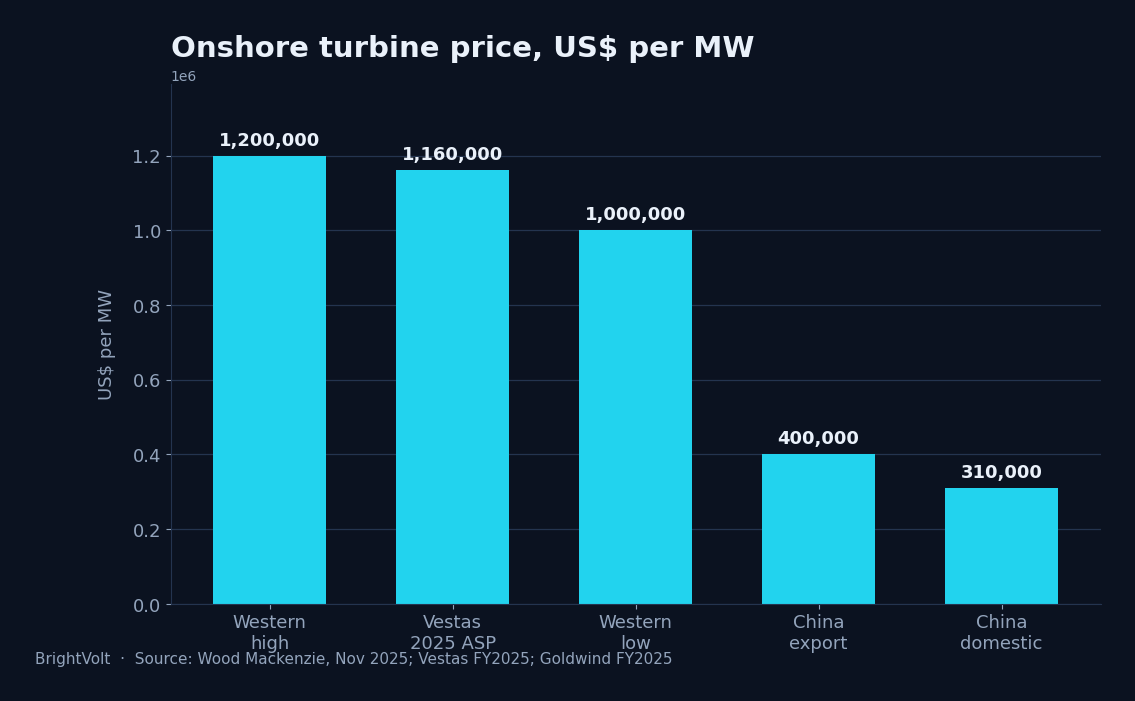
Western onshore turbines sell at $1.0m to $1.2m per MW on Wood Mackenzie’s numbers, up 45% since 2020. Wood Mackenzie’s read is that Western prices peaked in 2025 with gradual relief expected after 2027 — so the trend may be turning, five years late and after the capacity market has already re-rated the resource.
The harder number is the one Western manufacturers cannot answer. Chinese turbines export at roughly $400,000 per MW and sell domestically at about $310,000, against Vestas’s 2025 average selling price of €1.07m per MW. Goldwind’s 2025 results imply about $302,000 per MW across 26,626 MW shipped, at an 8.9% segment margin — which is to say Chinese manufacturers are profitable at prices where Western ones would not cover their bill of materials.
Vestas is profitable. Siemens Gamesa has narrowed its quarterly loss to €44 million from €249 million and guides to break-even. GE Vernova’s wind business lost $275 million in the second quarter of 2026, worse than the $165 million a year earlier, with orders down about 40%. Chinese manufacturers now hold eight of the top ten global positions.
So when the EIA’s planning data shows the United States adding 43.4 GW of utility-scale solar in 2026 against 11.8 GW of wind, that near-four-to-one ratio is not a market failing to value reliability. It is a market reading the accreditation table correctly and buying its winter security from batteries instead.
The case for wind that survives all of this
Offshore, and MISO.
Offshore wind is still credited at 60% in the 2028/29 auction — closer to a gas combined-cycle plant than to anything else on the renewable side, because sea breezes hold through winter nights when onshore wind drops and solar contributes nothing at all. It is also the most expensive electricity on the American grid, which is the entire difficulty in one sentence.
And PJM is not the whole country. MISO’s winter accreditation gap — 29% for wind against 5% for solar — is wider than PJM’s, its wind fleet is less saturated, and its winter risk is driven by a different mix. A four-hour battery covers a four-hour evening peak. It does not cover a five-day January cold snap, and nothing in the storage cost curve changes that until durations lengthen materially.
There is also a caveat that cuts against our own reading. PJM has said that the largest single driver of the change in its 2026/27 class ratings was its load scenarios rather than resource behaviour — roughly 60% of the movement from data-centre-elevated January demand. Accreditation numbers move when the load model moves, and a market that re-rates its resources this sharply in two years can re-rate them back.
What would change our mind
If the 2029/30 auction puts onshore wind back above 40% while storage stalls in the fifties, the crossover was a load-model artefact rather than a structural shift, and this piece is wrong. That is the single cleanest test and it arrives next year.
If eight-hour storage enters PJM as a distinct class at an accreditation well above four-hour’s — say 75% or better — then even the multi-day argument for wind narrows, and the case gets worse rather than better.
What would not change our mind is another year of wind generation records. The US produced 464,000 GWh of wind in 2025 against 296,000 GWh of utility-scale solar, and wind will remain the larger renewable in America for years. Energy produced and capacity credited are different currencies, and only one of them is what the auction pays for.
Photo by Damir K . on Pexels · Photo by Sergej *** on Pexels