
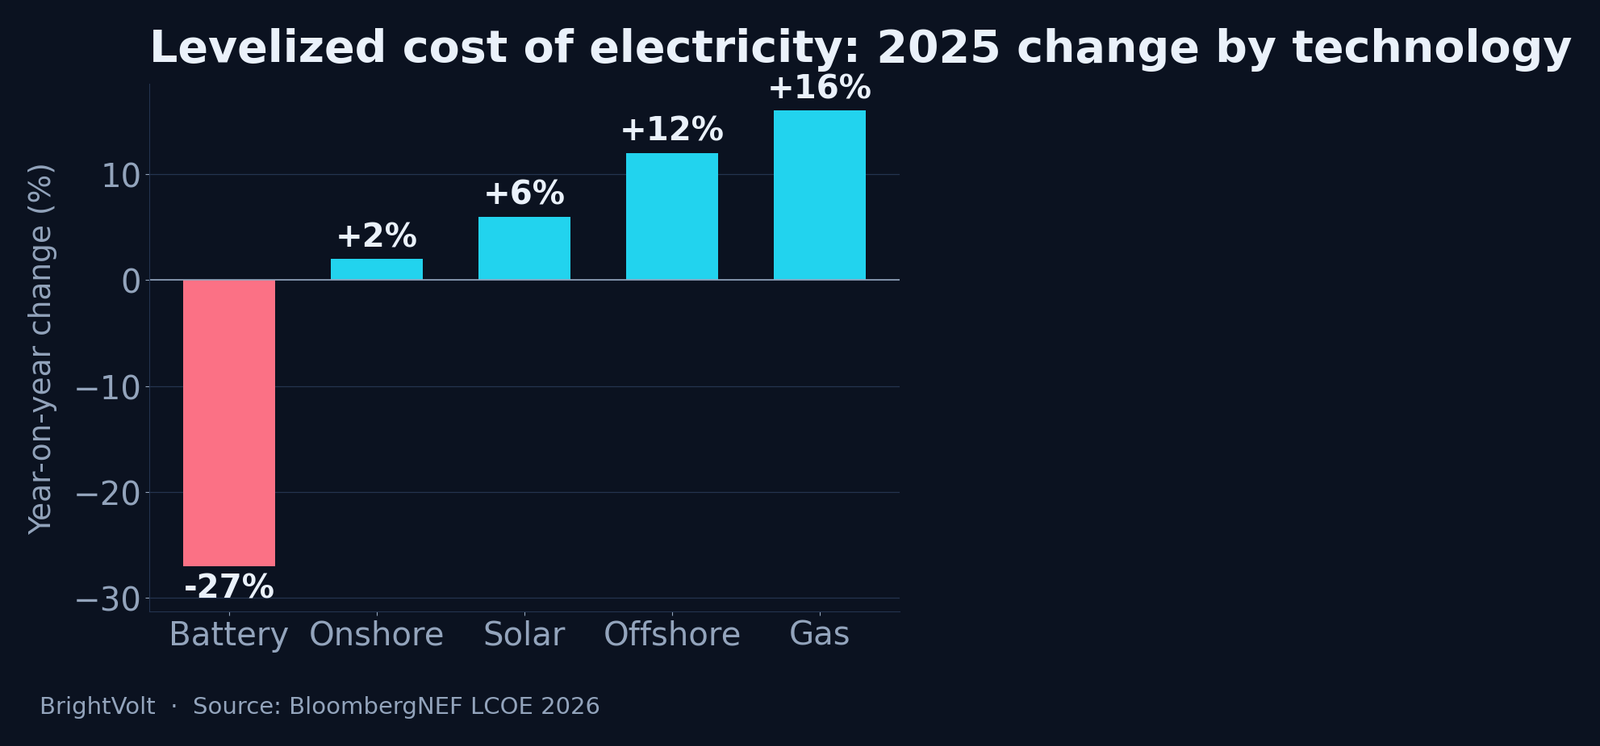
For about fifteen years the cost of new solar and wind electricity fell almost every year. In 2025 it rose. BloombergNEF puts its global benchmark for utility solar up 6% and offshore wind up 12% over the year, and Lazard has the levelized cost of US solar up 18%. The only part of the clean-power stack that kept getting cheaper was the battery.
That reversal is small in dollars and large in meaning. A 6% uptick does not make solar expensive — at $39/MWh it is still the cheapest new generation anyone can build. But a curve that fell for a decade and a half does not bend upward by accident, and the reasons it bent are not going away next quarter. The story everyone still tells about clean energy — that it only ever gets cheaper, so the job is simply to build more of it — is now describing a trend that has stopped.
What the two cost reports actually say
Two of the most-cited cost studies in the industry landed this year, built on different methods and different geographies, and they point the same way. BloombergNEF’s Levelized Cost of Electricity 2026, its seventeenth annual edition, found that in 2025 the global benchmark for fixed-axis solar rose to $39/MWh, onshore wind to $40, and offshore wind to $100 — up 6%, 2% and 12% respectively. Combined-cycle gas rose 16%. Battery storage went the other way, falling 27% to $78/MWh for a four-hour system.
Lazard’s 2026 LCOE+, looking at the US market, is blunter still: unsubsidized utility solar now runs $40–98/MWh, up from $38–78 a year earlier — an 18% jump — while renewables stay the cheapest new build even so. The two disagree on magnitude, and the gap is informative: the US figure rose three times as fast as the global benchmark, which is what tariff pass-through and a higher cost of capital look like in a single market.
| Technology | BNEF 2026, global ($/MWh, YoY) | Lazard 2026, US ($/MWh) |
|---|---|---|
| Utility solar | $39, +6% | $40–98, +18% |
| Onshore wind | $40, +2% | $37–99 |
| Offshore wind | $100, +12% | $105–167 |
| Combined-cycle gas | $102, +16% | $51–129 |
| Battery (4-hour) | $78, −27% | $210–292 (standalone LCOS) |
The one row to read carefully is the last. BNEF’s $78 is the levelized cost of a four-hour storage system inside its benchmarking frame, and it fell hard in 2025; Lazard’s $210–292 is the cost of standalone merchant storage on its own, and its “up about 27% since 2020” is a comparison to the pre-inflation baseline, not a claim that batteries got dearer last year. The two are measuring different machines. On the number that matters here — what a battery cost to buy and install in 2025 — the direction is not in dispute.
Why the curve bent
None of the forces pushing generation costs up is a one-year shock. Lazard names higher capital costs, sustained interest rates, tariff pass-through and supply-chain repricing; BNEF adds poorer resource availability and market reforms in China that have tightened the flow of ultra-cheap modules. Each of those sets a floor under the price of a new project, and most of them point to a floor that stays put.
The cost of capital is the heaviest of them, because a solar farm is almost all up-front spending repaid over twenty years — so its price is set less by the panel than by the interest rate on the money that bought it, the point BrightVolt’s cost-of-capital explainer was written to make. Then there is the queue. A project cannot earn until it connects, and the wait to connect has become its own cost line, as the interconnection-queue backlog shows. The most telling driver is the one bleeding in from next door: gas-turbine demand from data centres has pushed turbine prices up and dragged the gas benchmark 16% higher, and that scramble for firm power is now raising the cost of the thing renewables are supposed to displace.
The part that is still falling
Set against all that, one line on the cost sheet is still dropping, and dropping fast. Battery systems fell by more than a quarter in a single year, on manufacturing overcapacity spilling out of the electric-vehicle supply chain and on better pack and system design. Co-located solar-plus-storage came in at $57/MWh, with 87 GW of it deployed in 2025. The cheap component of a clean grid is no longer the generator. It is the thing that stores and shifts what the generator makes.
That is what should move money. When generation was in free-fall, the highest-return act was another field of panels. It no longer is, for two reasons. The first is price direction: another megawatt of solar now costs a little more than last year’s, while the battery beside it costs a quarter less. The second is worth more than the first. A grid already running heavily on renewables does not lack cheap daytime energy; it lacks the ability to move that energy to the evening, and increasingly it throws the surplus away because there is nowhere for it to go. The marginal panel earns less each year as it floods its own market. The marginal battery earns more, because it sells into the hours the panels cannot reach.
The obvious objection
The reasonable counter is that this is a rounding error dressed up as a turning point. Solar at $39 still beats gas at $102. Lazard still calls renewables the cheapest new generation there is. One year of a 6% rise, against fifteen of decline, is noise — wait for the tariffs to wash through and the curve resumes falling.
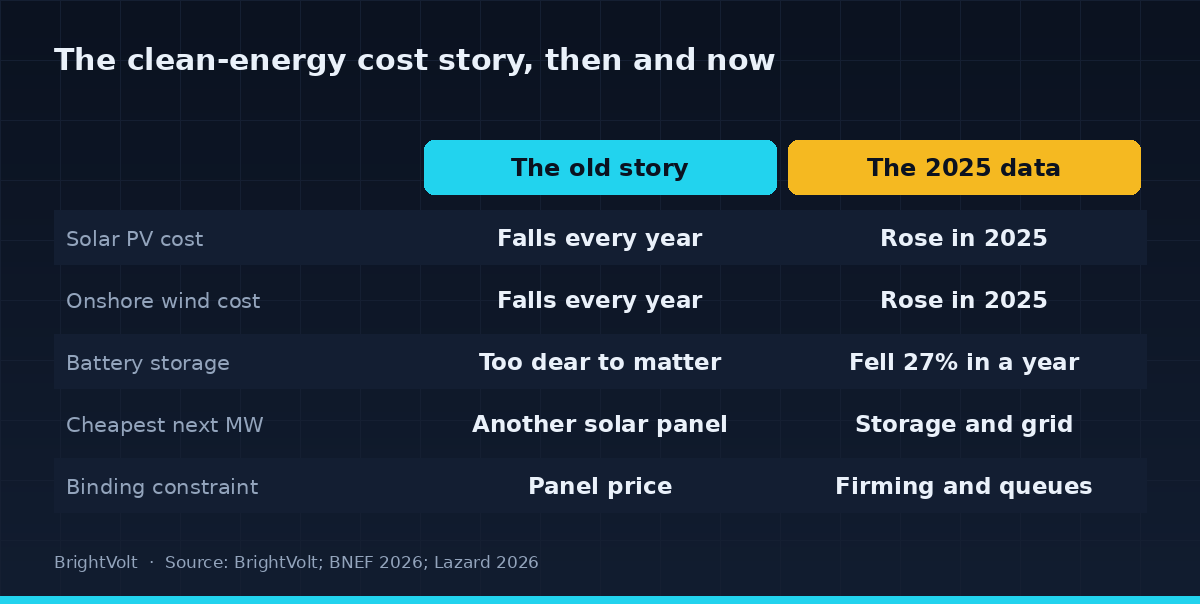
Two things answer it. The first is that direction carries information a level does not: a fifteen-year decline reversing tells you something about the next five years, and the drivers behind the reversal — rates, tariffs, queues, a turbine shortage with a multi-year lead time — are structural, not a blip waiting to clear. The second is the one the headline number hides. Levelized cost is the price of energy at the plant gate; it says nothing about delivering that energy when it is needed, the gap BrightVolt’s LCOE explainer exists to flag. As a grid climbs from 20% renewable toward 60%, the binding constraint shifts from the cost of making clean power to the cost of firming it — and firming is the one cost still on the way down. “Still the cheapest” is true, and it is answering a question the system has largely stopped asking.
What would change our mind
This read turns on the reversal being structural rather than a single bad year. The test is simple and arrives on a schedule: the 2027 editions of these same two reports. If utility solar and onshore wind resume their decline — module prices falling as the overcapacity and tariff churn clear, the cost of capital easing — then 2025 was a supply shock, the old story holds, and cheaper storage is a bonus laid on top of cheaper generation rather than a substitute for it. Watch three numbers between now and then: the direction of utility-solar LCOE in the next two annual editions, the long bond yield that sets the cost of capital, and whether offshore wind’s 12% rise reverses or compounds. If generation cost turns back down, we were wrong, and gladly. The 2025 data is not that world yet.
Photo by Kindel Media on Pexels · Photo by Quang Nguyen Vinh on Pexels · Photo by Kindel Media on Pexels