
Over China’s seven-day National Day holiday, Nio’s battery-swap network performed 1,192,221 swaps and BYD’s megawatt flash-charging network delivered about 1.22 million charges. The two totals are within three percent of each other. That near-tie is the story, and it is the one the viral headline — that swapping is “three times more efficient” than flash charging — quietly buries.
The holiday is the hardest week of the year for China’s charging infrastructure: hundreds of millions of people drive home at once, and the queues at motorway service areas are where the two rival refuelling models get stress-tested in public. Both companies published their numbers on October 9. Read together, they do not crown a winner. They explain what each model is for.
Where the “three times” figure comes from
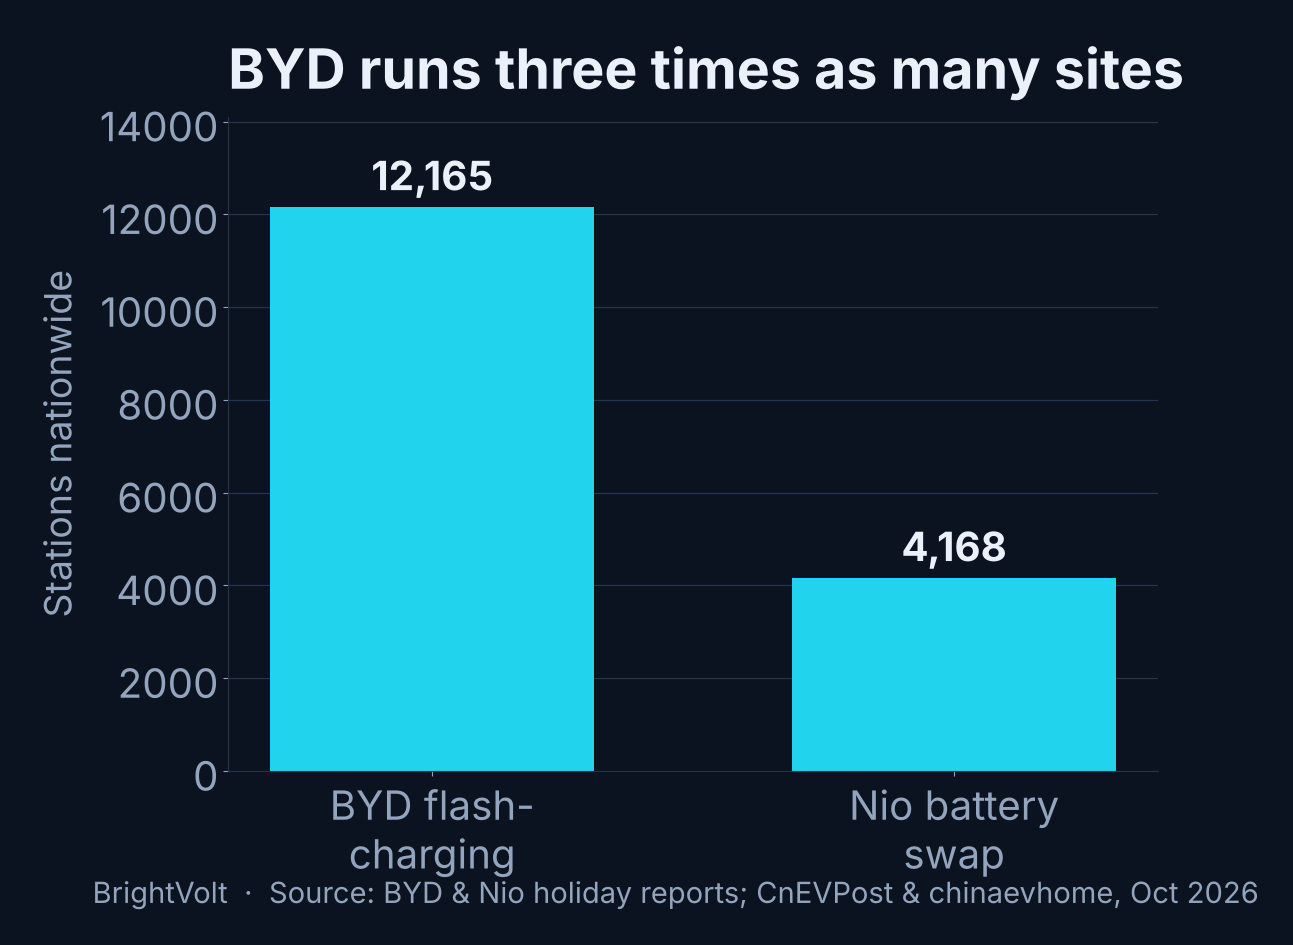
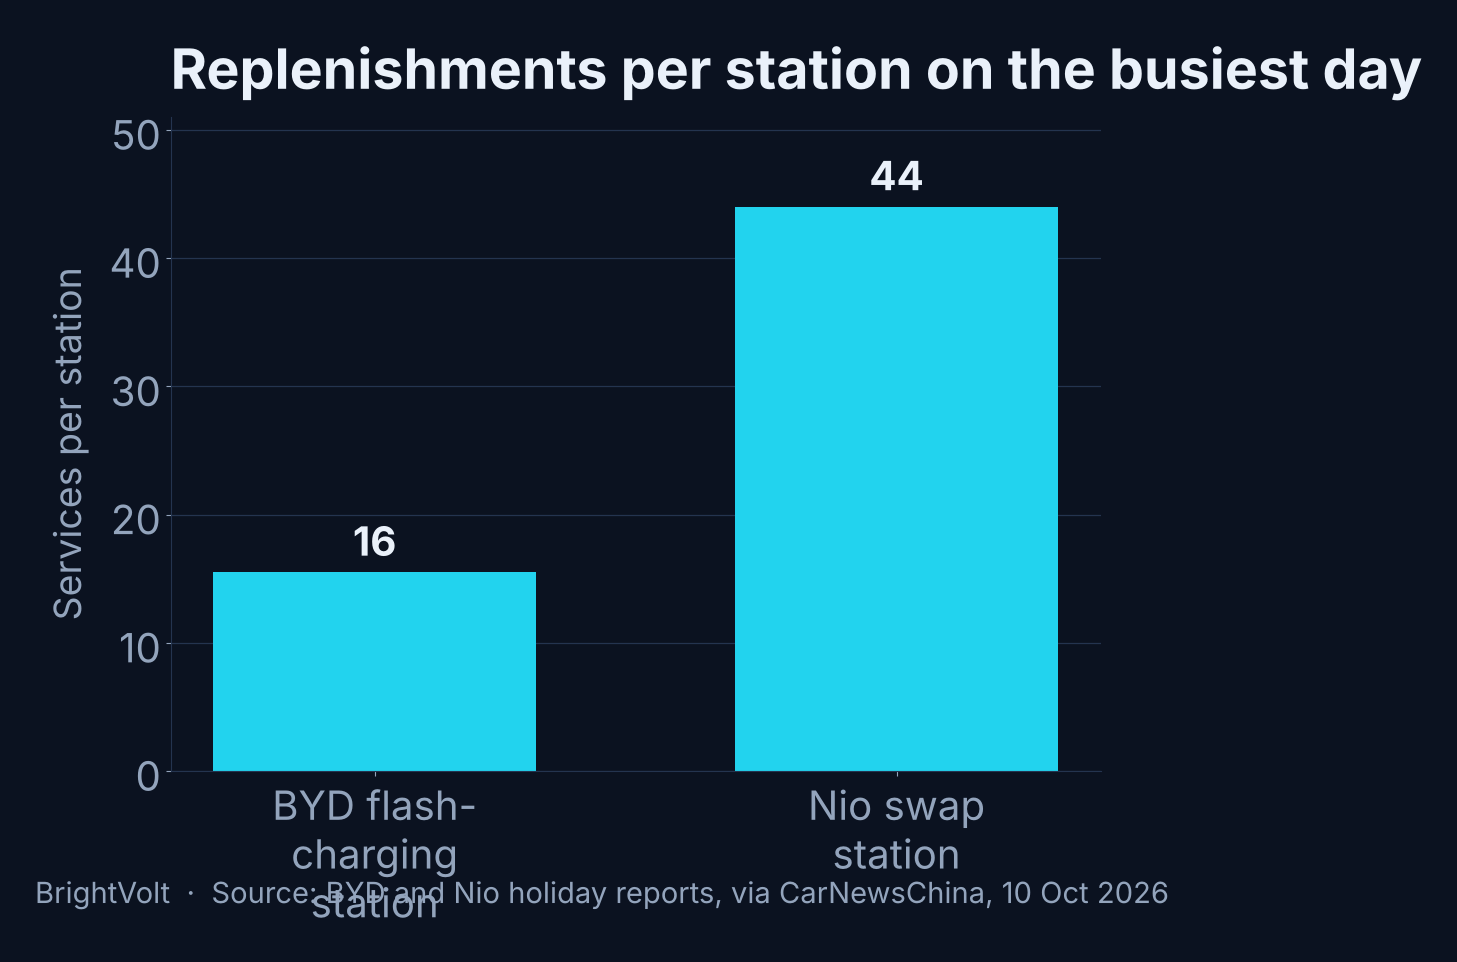
The ratio is real, and it is also an artefact. On its busiest day BYD handled 188,344 charges across 12,165 flash-charging stations — about 15.5 per station. Nio’s busiest day was 183,664 swaps across 4,168 swap stations — about 44 per station. Divide one by the other and you get the 2.8x that CarNewsChina rounded up to “three times.”
| Metric | BYD Flash Charging | Nio Battery Swap |
|---|---|---|
| Stations (as of 7 Oct) | 12,165 | 4,168 |
| Services over the week | ~1.22 million | 1,192,221 |
| Busiest single day | 188,344 | 183,664 |
| Per station, busiest day | 15.5 | 44 |
| Busiest single station | 160 | 211 |
Look at the last row. Measured station against station at the top of the range, the gap collapses: Nio’s busiest site did 211 swaps, BYD’s busiest did 160, a difference of a third rather than a multiple. The “three times” lives entirely in the average, and an average is a ratio of two numbers. The throughput sits on top. The station count sits underneath. BYD’s network is three times larger, so dividing a near-identical national total by three times as many sites was always going to produce a smaller number.
Why BYD’s per-station number is lower
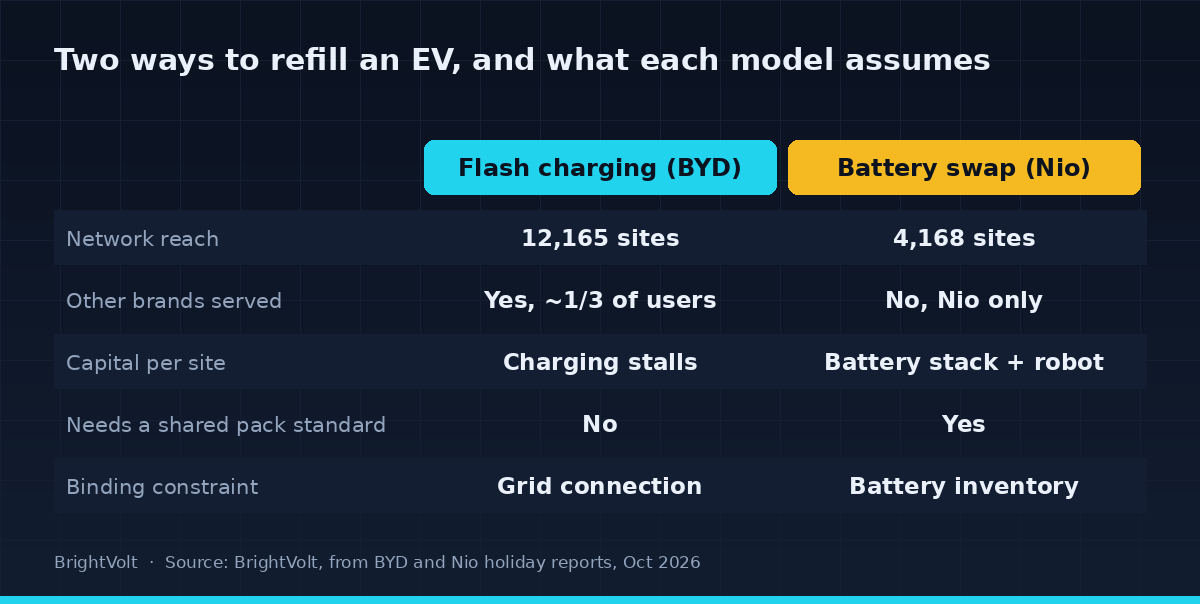
Three times the sites is not a weakness; it is the entire point of the model. BYD opened its 10,000th flash-charging station in late August and reached 12,165 across 341 cities by the holiday, with a declared target of 20,000 by year-end. A swap station is a building that holds a rotating stack of batteries and the robotics to change them; a flash-charging site is a pair of connectors on a grid feed. One scales the way petrol stations scale. The other does not.
The access model drags the average down a second time. Nearly a third of BYD’s flash-charging users drive other brands, because the network is open — and not every BYD on it can take the full 1,500 kW a connector delivers. A flash-capable car can sit behind an older model that cannot, so the queue moves at the speed of the slowest vehicle in it. Nio’s swap stations have no such problem for a simple reason: no other carmaker has joined, so every vehicle in the queue is a Nio built around the same pack. The network is a closed system optimised end to end, which is exactly why its throughput per site is higher — and exactly why it reaches a third of the cities BYD does.

What swapping genuinely wins, and what it doesn’t
Strip out the network-size confound and a real result remains: for a given site under peak load, swapping moves more cars. That is structural, not incidental. A swap decouples the slow step — putting energy back into a cell — from the stall itself; the depleted pack is recharged after the car has gone. At its peak Nio said a vehicle completed a swap and left every 0.47 seconds on average across the network. No charger, however fast, clears a bay that quickly, because the car has to stay plugged in while it fills. This is the same throughput logic BrightVolt has covered in BYD’s own grid-buffered flash chargers and in the physics of why a 1,000 kW charger never behaves like one.
What swapping does not win is the argument it is usually drafted into. The case against swapping for cars was never throughput; it was capital and standardisation, and this week changed neither. We made that case in August: scooter makers converged on a shared pack and built a swapping utility, while carmakers never will, because the battery is the most expensive and most differentiated thing in the vehicle. Nio’s throughput edge is the direct product of its network being single-brand — and a single-brand network is the thing nine rival automakers signed up to avoid building and then didn’t. Efficiency per site is impressive. It is also what you get when you solve the easy half of the problem and own the hard half yourself.
The two models are not really competing to refuel the same car. One is trading reach and open access for lower throughput per site; the other is trading reach for a closed network it can tune to the second.
What the holiday actually proved
It proved the throughput claim and left the economics claim exactly where it was. Swapping is faster per bay under load — settled, with a week of the heaviest demand China generates as evidence. Whether that matters depends on which constraint bites first on a real journey, and on a motorway in peak week the binding constraint is how many sites there are and how far apart, not how fast each one cycles. That is the number BYD is spending to win, and the one Nio cannot match without partners it does not have.
Two things to watch. The first is whether Nio’s per-site advantage holds as its base grows past the point where a single-brand network can be tuned so tightly — throughput per station was up only slightly on the May holiday despite 329 more sites. The second is BYD’s 20,000-station run-rate: if reach is the real prize, the network that is three times larger and growing by roughly 80 sites a day is winning the race that counts, and the per-station table is measuring the wrong thing. The headline said one model beat the other. The data said they are doing different jobs, and both are winning at the job they chose.
Image: Nio · Image: BYD